
A company can make a profit this year and still destroy value with one poor investment decision.
Imagine a manufacturer deciding whether to spend $750,000 on new equipment. The vendor says the machine will reduce labor costs, improve output, and pay for itself quickly. The operations team wants it. The sales team says production capacity is becoming a problem. The owner likes the idea because competitors are already automating.
But the real question is financial:
Will this investment create more value than it costs?
That is what capital budgeting is designed to answer.
Capital budgeting is the process companies use to evaluate large, long term investments before committing money. These projects may include machinery, factories, software systems, vehicles, warehouses, acquisitions, new stores, renewable energy systems, or major product development.
Unlike everyday expenses such as rent, salaries, or office supplies, capital investments usually require large upfront cash outflows and may affect the business for years. A wrong decision can tie up cash, increase debt, reduce flexibility, and pressure future profits.
A good capital budgeting process helps management compare projects, estimate cash flows, account for risk, and decide which investments deserve funding.
Key Takeaways
- Capital budgeting helps companies decide whether large, long term investments are worth funding.
- The main methods include net present value, internal rate of return, payback period, profitability index, and accounting rate of return.
- Net present value is usually the strongest method because it measures value created in today’s money.
- A project can look profitable on paper but still hurt cash flow if it requires heavy working capital, debt, maintenance, or delayed customer payments.
- The cost of capital matters. A project that looks attractive at an 8% required return may fail at a 12% required return.
- Taxes and depreciation affect real cash flow. The IRS explains that business property costs are generally recovered through depreciation deductions, including MACRS and certain Section 179 elections.
- Capital budgeting is best for business owners, CFOs, finance teams, investors, lenders, and managers making major spending decisions.
Capital Budgeting Definition

Capital budgeting is the financial process of evaluating and selecting long term investment projects.
The word “capital” refers to money invested in assets that should benefit the business beyond the current year. The word “budgeting” refers to deciding how limited capital should be allocated.
A company may have five possible projects but only enough cash or borrowing capacity to fund two of them. Capital budgeting helps rank those projects based on expected return, risk, timing, and strategic value.
Examples of capital budgeting decisions include:
- Buying a $500,000 delivery fleet
- Opening a new retail location
- Building a factory
- Installing warehouse automation
- Replacing outdated machinery
- Buying enterprise software
- Acquiring a competitor
- Launching a new product line
- Investing in solar panels or energy efficiency
- Expanding into a new market
The goal is not simply to spend less. Sometimes the cheapest option is the wrong option.
The goal is to commit capital where the expected return justifies the cost, risk, and loss of flexibility.
Why Capital Budgeting Matters to Your Wallet
Capital budgeting matters because large investments affect cash flow for years.
Suppose a business spends $500,000 on equipment that is expected to generate $145,000 in annual after tax cash flow for five years.
At first glance, that looks attractive:
$145,000 × 5 years = $725,000 total cash inflow
That is $225,000 more than the initial investment.
But money received five years from now is not worth the same as money spent today. The company could have used that cash elsewhere, paid down debt, kept it as a reserve, or invested in another project.
If the company uses a 10% required return, the present value of those five annual cash flows is about $549,700. After subtracting the $500,000 investment, the net present value is roughly $49,700.
That means the project is expected to create value.
But if annual cash flow falls to $125,000, the present value drops to about $473,900. The net present value becomes negative by about $26,100.
The same project can move from attractive to unattractive with one realistic change in cash flow.
This is why capital budgeting matters. It forces management to test numbers before spending money that may be hard to recover.
Capital Budgeting vs Operating Budgeting
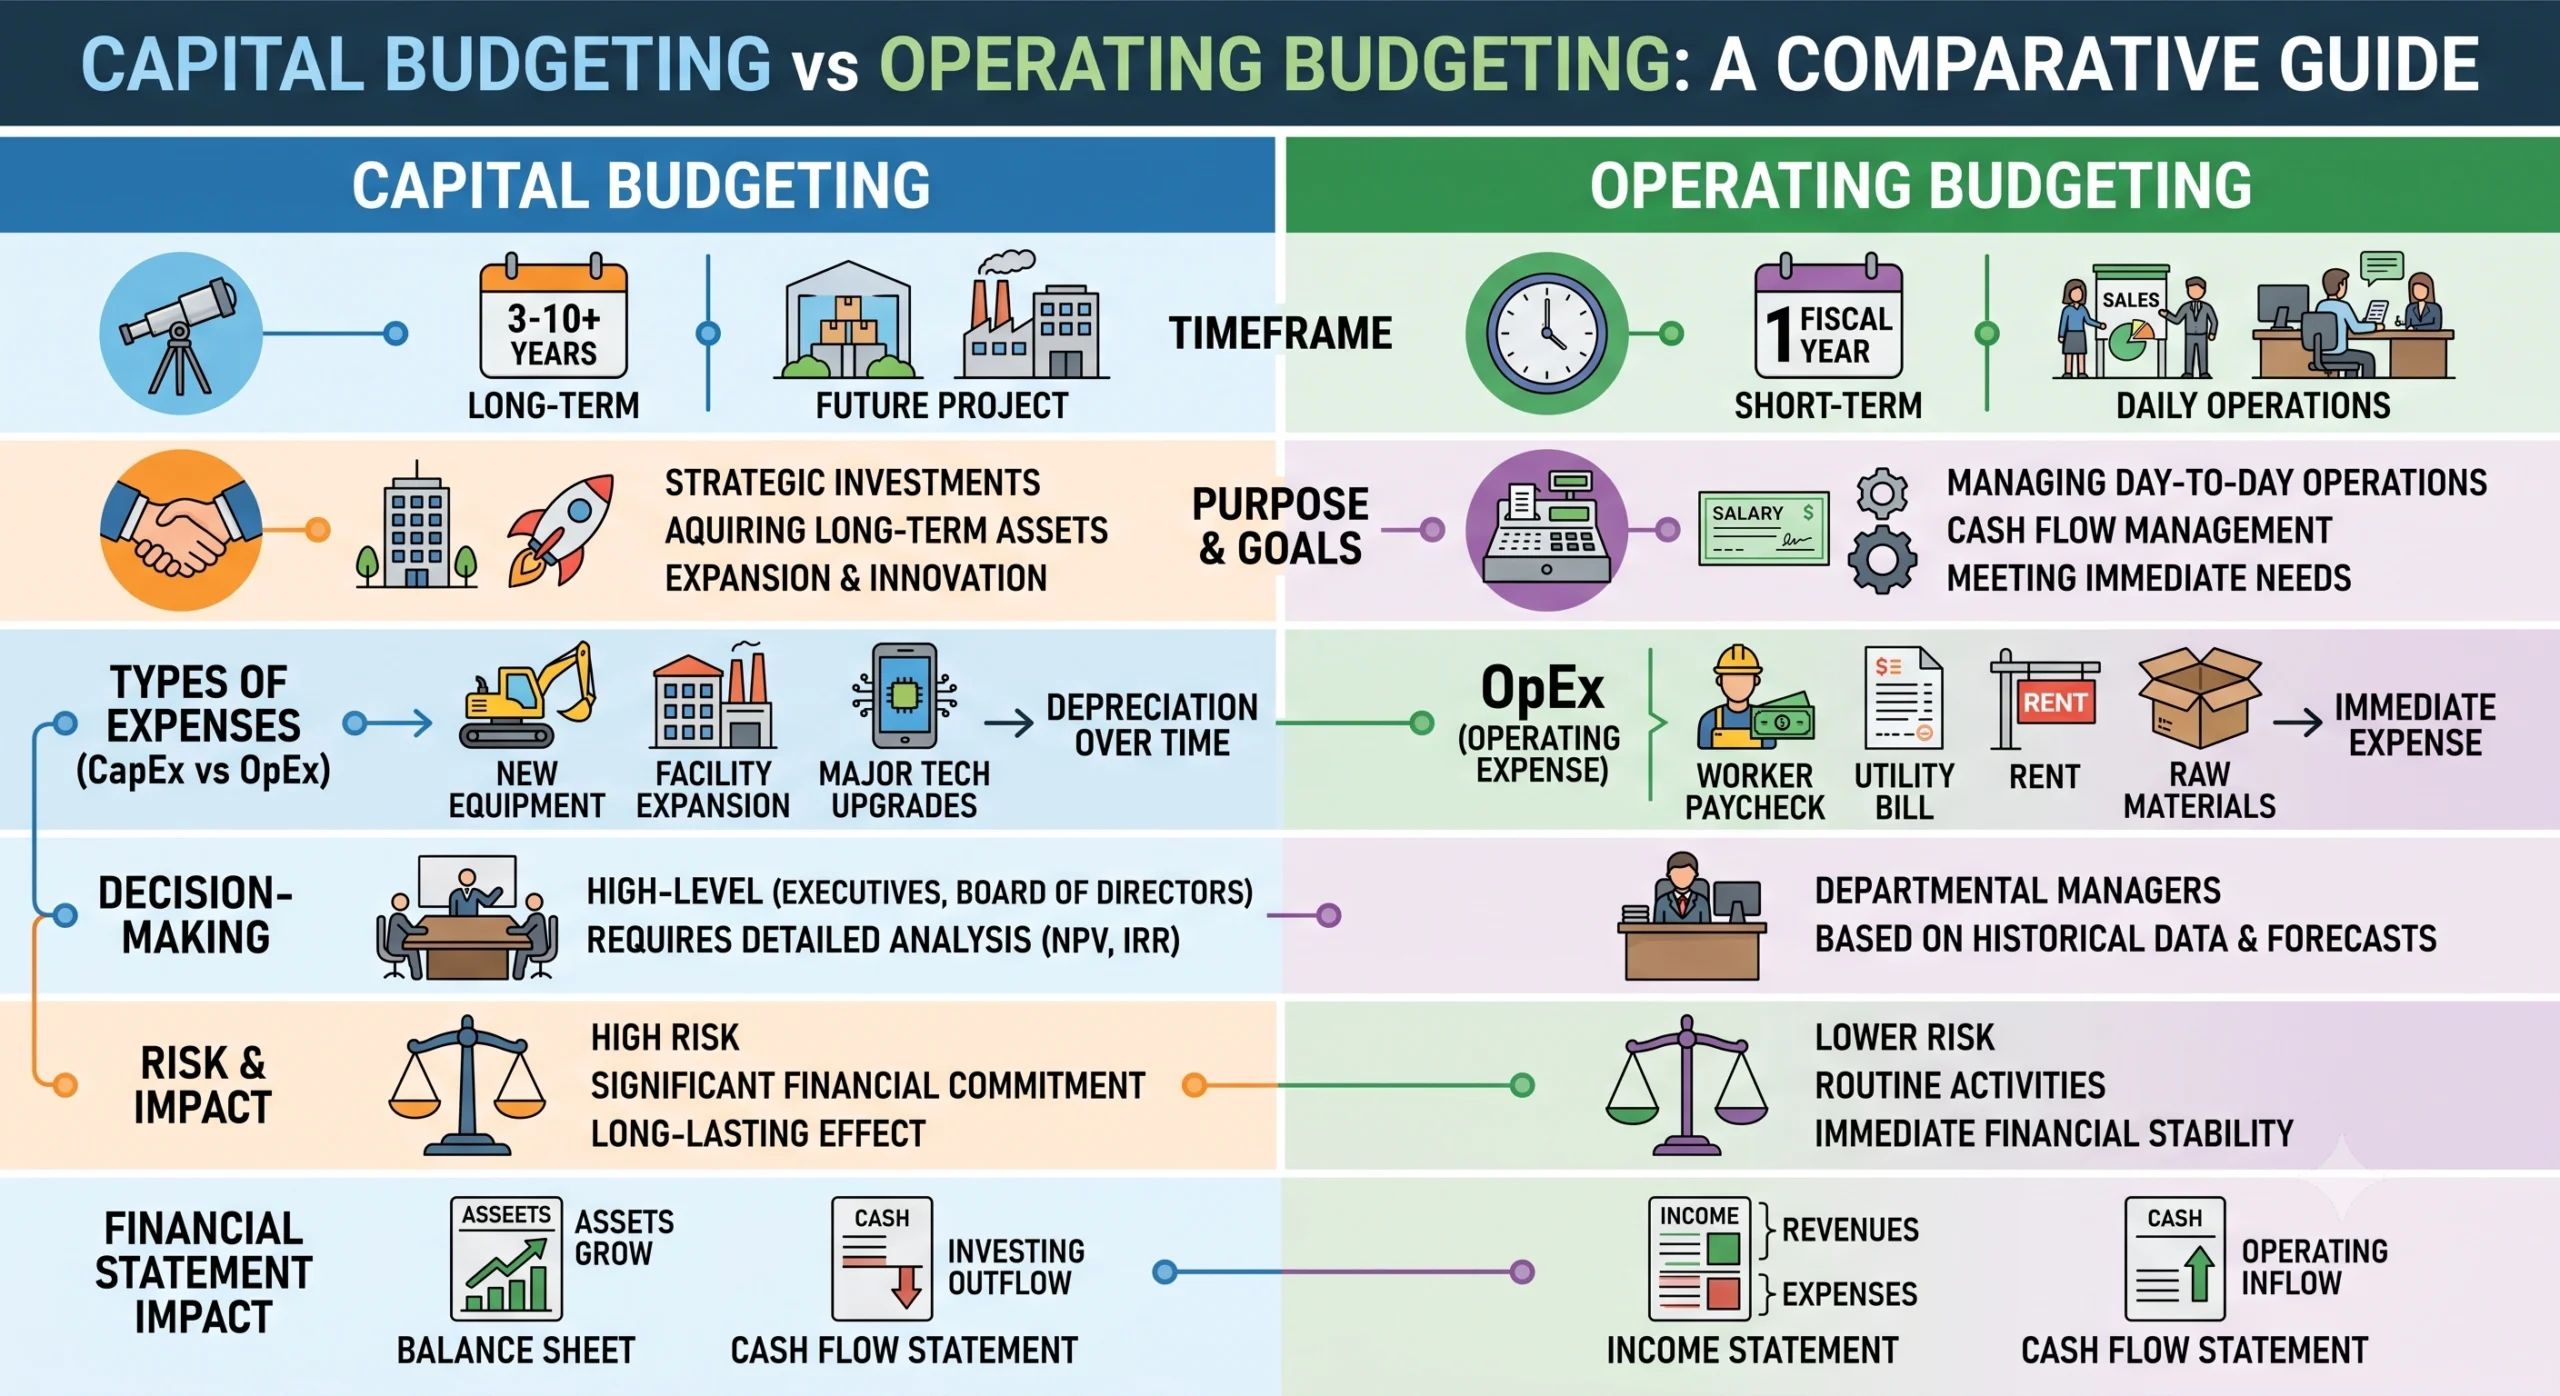
Capital budgeting is different from ordinary budgeting.
An operating budget covers day to day income and expenses. A capital budget covers long term investments.
| Area | Operating Budget | Capital Budget |
|---|---|---|
| Main Purpose | Plan revenue, payroll, rent, marketing, utilities, and other recurring costs | Evaluate long term assets and major projects |
| Time Horizon | Usually monthly, quarterly, or annual | Often 3 to 10 years or longer |
| Examples | Salaries, office rent, subscriptions, ads, travel | Equipment, factories, vehicles, software implementation, acquisitions |
| Main Question | Can the business operate within its plan? | Will this project create enough value to justify the investment? |
| Financial Focus | Profit, expense control, cash timing | Cash flows, NPV, IRR, payback, risk, financing |
Both are connected.
A new machine may be a capital budgeting decision. Its maintenance cost, training cost, insurance, depreciation, and staffing impact will affect future operating budgets.
The Core Features of Capital Budgeting
Capital budgeting works best when it follows a clear process.
Project Identification
The first step is identifying possible investment opportunities.
These may come from operations, finance, sales, technology, customer demand, competitive pressure, regulation, or strategic planning.
A project should begin with a business case that explains:
- What problem the project solves
- What asset or investment is required
- How much cash is needed upfront
- What benefits are expected
- When those benefits will arrive
- What risks could reduce the return
- What happens if the company does nothing
For example, “buy new equipment” is not enough. A stronger project proposal would say:
“The company should invest ₹2.5 crore in automated packaging equipment to reduce labor cost by ₹42 lakh per year, increase output capacity by 25%, reduce product defects from 3.5% to 1.5%, and support projected order growth over the next five years.”
That proposal gives finance something to test.
Cash Flow Estimation
Capital budgeting should focus on cash flow, not accounting profit alone.
Relevant cash flows may include:
- Initial purchase price
- Installation costs
- Shipping and duties
- Training costs
- Maintenance expenses
- Labor savings
- Additional revenue
- Tax effects
- Working capital changes
- Salvage value
- Financing costs, depending on method
- Exit or disposal costs
The biggest mistake is ignoring costs that do not appear in the vendor quote.
A machine that costs $500,000 may require $40,000 of installation, $25,000 of staff training, $15,000 of annual maintenance, higher insurance, and $80,000 of additional inventory to support higher production.
The headline price is rarely the true project cost.
Time Value of Money
Capital budgeting uses time value of money.
A dollar today is worth more than a dollar received later because today’s dollar can be invested, used to reduce debt, or kept available for emergencies.
This is why NPV and discounted cash flow matter.
If a company uses a 10% discount rate, $100,000 received one year from now is worth about $90,909 today.
$100,000 ÷ 1.10 = $90,909
The further away the cash flow is, the less it is worth today.
Risk Assessment

Every capital project contains risk.
Common risks include:
- Sales volume below forecast
- Higher construction or installation costs
- Supplier delays
- Technology failure
- Customer demand changes
- Higher interest rates
- Currency movements
- Regulatory delays
- Cost overruns
- Maintenance issues
- Shorter asset life than expected
A good capital budget does not use only one forecast.
It should include base case, upside case, and downside case assumptions.
For example:
| Scenario | Revenue Benefit | Cost Savings | Project NPV |
|---|---|---|---|
| Upside Case | $220,000 per year | $80,000 per year | $315,000 |
| Base Case | $160,000 per year | $65,000 per year | $49,700 |
| Downside Case | $95,000 per year | $40,000 per year | Negative $140,000 |
This helps management see the risk before approving the project.
Capital Rationing
Capital rationing happens when a company has more good projects than available money.
A company may have $5 million available for capital projects but $12 million of proposals.
Finance must then rank projects based on return, strategic importance, risk, timing, and liquidity.
Capital rationing is where the profitability index can be useful because it compares value created per dollar invested.
The Main Capital Budgeting Methods
Most finance teams use more than one method. Each one answers a different question.
Net Present Value
Net present value, or NPV, estimates how much value a project creates after discounting future cash flows back to today.
The formula is:
NPV = Present Value of Future Cash Flows − Initial Investment
A positive NPV means the project is expected to create value above the required return.
A negative NPV means the project may destroy value.
NPV Example
A company invests $500,000 in equipment.
Expected annual after tax cash flow: $145,000
Project life: 5 years
Discount rate: 10%
| Year | Cash Flow | Present Value at 10% |
|---|---|---|
| 0 | $(500,000) | $(500,000) |
| 1 | $145,000 | $131,818 |
| 2 | $145,000 | $119,835 |
| 3 | $145,000 | $108,941 |
| 4 | $145,000 | $99,037 |
| 5 | $145,000 | $90,034 |
| Total PV of Inflows | $549,665 | |
| Net Present Value | $49,665 |
The NPV is positive, so the project appears financially acceptable.
NPV is widely preferred because it measures the project in actual currency terms. A $500,000 NPV is more meaningful than simply saying a project has a 14% return.
Internal Rate of Return

Internal rate of return, or IRR, is the discount rate that makes NPV equal zero.
If the IRR is higher than the company’s required return, the project may be acceptable.
Using the same example with a $500,000 investment and $145,000 annual cash flow for five years, the IRR is about 13.4%.
If the company’s required return is 10%, the project clears the hurdle.
If the company requires 15%, the project fails.
IRR is easy to communicate because managers understand percentages. Its weakness is that it can mislead when projects have unusual cash flows, different sizes, or multiple changes in cash flow direction.
A small project with a 40% IRR may create less dollar value than a large project with a 14% IRR.
Payback Period
Payback period shows how long it takes to recover the initial investment.
The formula is:
Payback Period = Initial Investment ÷ Annual Cash Flow
Using the example:
$500,000 ÷ $145,000 = 3.45 years
The project pays back in about 3 years and 5 months.
Payback is simple and useful for liquidity planning. But it ignores the time value of money and ignores cash flows after the payback date.
A project that pays back in two years but creates little value afterward may be weaker than a project that pays back in four years but generates strong cash flow for ten years.
Profitability Index
Profitability index measures the present value of future cash flows per dollar invested.
The formula is:
Profitability Index = Present Value of Future Cash Flows ÷ Initial Investment
Using the example:
$549,665 ÷ $500,000 = 1.10
A profitability index above 1.0 means the project creates value.
This method is especially helpful when capital is limited. If two projects both have positive NPV, the profitability index can show which one creates more value per dollar invested.
Accounting Rate of Return
Accounting rate of return, or ARR, measures average accounting profit relative to the investment.
The formula is often shown as:
ARR = Average Annual Accounting Profit ÷ Initial Investment
ARR is easy to calculate, but it is weaker than NPV because it uses accounting profit rather than cash flow and does not properly account for time value of money.
ARR may be useful as a secondary measure when management wants to understand the impact on reported earnings. It should not be the main basis for approving major projects.
Capital Budgeting Methods Compared
| Method | What It Measures | Best Use | Main Strength | Main Weakness |
|---|---|---|---|---|
| Net Present Value | Dollar value created after discounting cash flows | Most major capital decisions | Shows actual value created | Requires reliable cash flow and discount rate assumptions |
| Internal Rate of Return | Percentage return implied by cash flows | Comparing return against hurdle rate | Easy to communicate | Can mislead with unusual or uneven cash flows |
| Payback Period | Time required to recover initial investment | Liquidity and risk screening | Simple and practical | Ignores value after payback and time value of money |
| Profitability Index | Value created per dollar invested | Capital rationing | Useful when funding is limited | Can favor smaller projects over larger value creators |
| Accounting Rate of Return | Accounting profit relative to investment | Earnings impact review | Easy to understand | Based on accounting profit, not cash flow |
Which Method Wins?
NPV usually wins for serious capital budgeting because it tells management how much value the project is expected to create in today’s money.
IRR wins when management needs a quick percentage return to compare against a hurdle rate.
Payback period wins when liquidity and speed of recovery matter. For example, a business with limited cash may prefer a project that pays back in 18 months over one that pays back in seven years.
Profitability index wins when the company has limited funds and must choose the best combination of projects.
ARR is best treated as a supporting metric, not the final decision rule.
How to Build a Capital Budgeting Model

A capital budgeting model does not need to be complicated. It does need to be disciplined.
Step 1: Define the Project
Start with a clear description.
What is being purchased or built? Why is it needed? What business problem does it solve? Who owns the project? When will it begin? When will it start producing financial benefits?
Step 2: Estimate Initial Investment
Include every upfront cost.
| Cost Item | Example Amount |
|---|---|
| Equipment purchase | $500,000 |
| Shipping and duties | $20,000 |
| Installation | $35,000 |
| Training | $15,000 |
| Initial spare parts | $10,000 |
| Additional working capital | $80,000 |
| Total Initial Cash Requirement | $660,000 |
A project that looks like a $500,000 investment may actually require $660,000 of cash before it begins creating value.
Step 3: Estimate Annual Cash Benefits
Benefits may include new revenue, cost savings, lower defects, lower energy use, fewer employees needed for manual work, faster production, or lower maintenance.
Example:
| Annual Benefit | Amount |
|---|---|
| Labor savings | $110,000 |
| Scrap reduction | $30,000 |
| Additional contribution margin from higher output | $75,000 |
| Lower maintenance on old equipment | $15,000 |
| Total Annual Benefit | $230,000 |
Step 4: Estimate Annual Costs
New assets may create new expenses.
| Annual Cost | Amount |
|---|---|
| Maintenance contract | $25,000 |
| Insurance increase | $8,000 |
| Software license | $12,000 |
| Additional technician support | $30,000 |
| Total Annual Cost | $75,000 |
Net annual operating benefit:
$230,000 − $75,000 = $155,000
Step 5: Account for Taxes and Depreciation
Taxes and depreciation change cash flow.
Depreciation is a noncash expense that reduces taxable income. The IRS explains that Publication 946 covers how businesses can recover the cost of business or income-producing property through depreciation deductions, including MACRS and Section 179 rules.
If a company has $155,000 of pre-tax operating benefit and pays a 21% corporate tax rate, after tax benefit would be:
$155,000 × (1 − 21%) = $122,450
Actual tax treatment can be more complex because depreciation rules, bonus depreciation, state taxes, tax credits, financing structure, and entity type may change the result. IRS Publication 542 discusses general tax laws that apply to ordinary domestic corporations, but it does not cover every situation.
Step 6: Add Salvage Value and Working Capital Recovery
Some projects have value at the end.
A machine may be sold for $75,000 after five years. Working capital tied up in inventory may also be released when the project ends.
If the project required $80,000 of additional working capital and that amount is recovered in year five, it should be added to the final year cash flow.
Step 7: Discount the Cash Flows
Use a discount rate that reflects the company’s cost of capital and project risk.
The Federal Reserve held the federal funds target range at 3.50% to 3.75% on June 17, 2026. That rate is not a company’s cost of capital, but it influences borrowing costs across the economy.
A small private business with limited collateral may face a higher borrowing cost than a large public company. A risky new product launch should usually require a higher return than replacing a worn-out machine with a proven alternative.
Step 8: Run Sensitivity Analysis
Sensitivity analysis shows what happens when key assumptions change.
For example:
| Annual Cash Flow | 8% Discount Rate | 10% Discount Rate | 12% Discount Rate |
|---|---|---|---|
| $125,000 | $(1,000) | $(26,100) | $(48,300) |
| $145,000 | $78,900 | $49,700 | $23,800 |
| $165,000 | $158,700 | $125,400 | $95,900 |
This table shows that the project is sensitive to cash flow assumptions.
At $145,000 of annual cash flow, the project works at 8%, 10%, and 12%. At $125,000, it becomes weak or negative.
Capital Budgeting Pricing Structure
Capital budgeting itself is not a subscription product. The cost comes from the tools, data, financing, tax advice, engineering review, and professional support used to evaluate and execute a project.
The table below separates basic modeling costs from larger project evaluation costs.
| Cost Item | Current or Typical Pricing | What It Covers | Hidden Cost to Watch |
|---|---|---|---|
| LibreOffice Calc | Free | Basic spreadsheet modeling and NPV analysis | Limited enterprise collaboration and finance workflow controls |
| Microsoft Excel for the web | Free with Microsoft account | Basic online spreadsheet modeling | Fewer desktop features than paid Excel |
| Microsoft 365 Business Basic, no Teams | ₹130 per user per month, paid yearly | Web and mobile Excel, business email, cloud storage | GST extra and annual subscription terms apply |
| Microsoft 365 Apps for business | ₹830 per user per month, paid yearly | Desktop Excel, Word, PowerPoint, Outlook, and 1 TB cloud storage | GST extra and auto-renewal apply |
| CFI FMVA India | ₹12,000 per year | Financial modeling and valuation training | Training only, not project advice |
| Capital planning software | Quote-based | Multi-project planning, approvals, scenario models, reporting | Implementation and integration costs |
| Engineering or technical review | Quote-based | Validates equipment, construction, capacity, or technical assumptions | Scope can expand quickly |
| Tax advisor review | Quote-based | Depreciation, deductions, tax credits, entity-specific tax effects | Tax treatment can change cash flow materially |
| Financing cost | Interest rate, fees, collateral, covenants | Funds the project | Floating rates, covenants, and refinancing risk |
LibreOffice describes its suite as free and open source, with Calc available as a spreadsheet tool for analyzing data, calculating figures, and creating visuals. Microsoft lists Microsoft 365 Business Basic without Teams at ₹130 per user per month on annual billing, and Microsoft 365 Apps for business at ₹830 per user per month on annual billing with desktop Excel and 1 TB of cloud storage. GST is extra. CFI lists FMVA India at ₹12,000 annually, billed as $125 per year.
For larger companies, Oracle’s enterprise performance management planning product includes planning across financial statements, revenue, expenses, workforce, capital, and scenario models. Pricing is generally handled through enterprise quotes rather than a simple public monthly plan.
Capital Budgeting Tools Compared
| Tool or Approach | Starting Cost | Best For | Strength | Limitation |
|---|---|---|---|---|
| LibreOffice Calc | Free | Small businesses, students, basic NPV models | No software cost | Less standard in finance teams |
| Excel for the web | Free | Simple shared models and early analysis | Easy entry point | Limited compared with desktop Excel |
| Desktop Excel through Microsoft 365 | ₹830 per user per month for Apps for business | Professional finance models, sensitivity tables, project analysis | Strong modeling flexibility | Requires subscription and user discipline |
| CFI FMVA Training | ₹12,000 per year in India | Learning financial modeling and capital budgeting | Structured training | Does not replace internal data or advisor review |
| Enterprise planning software | Quote-based | Large companies managing many projects | Workflow, approvals, capital planning, reporting | Setup cost and implementation complexity |
Which Tool Wins?
LibreOffice wins if cost is the main issue and the company only needs a basic capital budgeting model.
Excel for the web wins for early analysis and simple collaboration.
Desktop Excel wins for most serious capital budgeting models because it offers more flexibility for NPV, IRR, sensitivity analysis, data tables, debt schedules, and scenario modeling.
CFI wins for individuals who need to learn the skill rather than evaluate one immediate project.
Enterprise planning software wins when a company has many business units, several capital projects, formal approval workflows, and recurring board level reporting.
Real World Capital Budgeting Facts Investors Should Know
Capital budgeting is closely tied to accounting, taxes, interest rates, and public-company reporting.
Public companies disclose audited financial statements in Form 10-K filings. Investor.gov states that Form 10-K provides a comprehensive overview of a company’s business and financial condition and includes audited financial statements.
Those financial statements can show capital expenditure through the cash flow statement, fixed assets on the balance sheet, and depreciation in the income statement or notes.
The SEC’s guide to reading a 10-K explains that Item 8 includes audited financial statements such as the income statement, balance sheet, cash flow statement, and statement of stockholders’ equity, while notes explain the numbers presented.
Capital budgeting also depends on cost inflation. The Bureau of Labor Statistics Producer Price Index measures the average change over time in selling prices received by domestic producers. Businesses evaluating machinery, construction, raw materials, or commercial equipment should not rely on old vendor quotes when input prices are changing.
Common Capital Budgeting Mistakes
Using Accounting Profit Instead of Cash Flow
Profit is not the same as cash.
A project may increase accounting profit while requiring inventory, receivables, training, installation, and maintenance cash upfront.
Capital budgeting should focus on incremental cash flows.
Ignoring Working Capital
A new product line may require extra inventory and customer credit terms.
If the project needs $200,000 of additional working capital, that money should be included in the initial investment.
Treating Vendor Estimates as Final Costs
Vendor quotes often exclude installation, training, downtime, spare parts, financing, maintenance, insurance, and disposal costs.
A $500,000 equipment project can easily become a $650,000 cash commitment.
Using One Forecast
A single base case can hide risk.
Every major project should have upside, base, and downside cases. The downside case should be realistic, not dramatic for the sake of fear.
Ignoring Opportunity Cost
Using cash for one project means not using it elsewhere.
A company that spends $1 million on equipment may lose the flexibility to acquire a competitor, reduce debt, hire a sales team, or protect cash during a slowdown.
Confusing IRR With Value Creation
A high IRR is not always the best project.
A $50,000 project with a 40% IRR may create less total value than a $2 million project with a 14% IRR.
NPV helps solve this because it measures value in currency, not only percentages.
Forgetting Post-Audit Review
After the project is completed, compare actual results with the original business case.
Did the project cost more than expected? Did cash benefits arrive on time? Were savings overstated? Did the asset perform as expected?
This improves future capital budgeting decisions.
Final Strategic Verdict
Capital budgeting is perfect for business owners, CFOs, finance managers, investors, lenders, and department leaders deciding whether a major investment deserves funding.
It is especially useful before buying equipment, opening a new location, investing in software, expanding production, launching a new product, acquiring another company, or taking on debt for a long term asset.
Small businesses should start with a simple model that includes initial investment, annual cash inflows, annual costs, taxes, working capital, salvage value, NPV, IRR, and payback period.
Larger companies should add formal approval workflows, risk scoring, scenario analysis, capital rationing, financing review, and post-completion audits.
Capital budgeting should be avoided only when it becomes a formality used to justify a decision management already made. A model built on inflated revenue assumptions and missing costs creates false confidence.
The best capital budgeting process is practical and honest. It asks how much cash goes out, when cash comes back, what can go wrong, what return is required, and whether the project creates more value than the next best use of the money.