
A finance professional can look at a company’s revenue, profit, debt, and cash flow and reach a conclusion in minutes. A beginner may see the same numbers and feel lost.
The difference is not advanced mathematics.
It is financial modeling.
Financial modeling is the process of turning financial data and business assumptions into a structured spreadsheet that explains how a company makes money, spends money, manages debt, generates cash, and may perform in the future.
A good financial model can answer questions such as:
- Can a business afford to hire 20 new employees?
- What happens if sales grow by 10% but customers pay invoices 15 days later?
- Is a company’s stock price reasonable compared with its cash flow?
- Can a business repay a loan if interest rates rise?
- How much revenue is required to reach a target profit?
- Is an acquisition likely to create value or destroy it?
You do not need an MBA, a finance degree, or investment banking experience to start learning financial modeling. You do need patience, spreadsheet discipline, and a willingness to work through financial statements until they make sense.
Key Takeaways
- Financial modeling means using spreadsheets to forecast revenue, expenses, cash flow, debt, and business value.
- Beginners should learn accounting basics before building complex valuation or private-equity models.
- Excel skills matter, but spreadsheet speed is not enough. You need to understand why each formula exists.
- The best starting point is a simple three-statement model that links the income statement, balance sheet, and cash flow statement.
- Public company 10-K and 10-Q filings are free sources of real financial data for practice.
- A realistic beginner schedule is 8 to 12 weeks of consistent work, not one weekend of watching videos.
- Free tools are enough to begin. Paid courses make sense when you want structured case studies, certificates, model feedback, or investment-banking-focused training.
What Is Financial Modeling?

Financial modeling is the process of building a spreadsheet that represents how a business operates financially.
Most financial models are built in Microsoft Excel. They use historical financial statements, assumptions, formulas, and forecasts to estimate future results.
Wall Street Prep describes financial modeling as a tool for understanding and analyzing an underlying business to support decision-making. Common models include three-statement models, discounted cash flow analysis, comparable-company analysis, merger models, and leveraged buyout models.
A beginner does not need to start with a merger model or a leveraged buyout model.
Start with the financial foundation.
A basic model should help you understand how:
- Revenue affects gross profit
- Gross profit affects operating income
- Operating income affects net income
- Sales growth affects receivables and inventory
- Working capital affects cash flow
- Debt affects interest expense
- Capital expenditure affects cash and fixed assets
- Net income affects retained earnings
That chain is the heart of financial modeling.
Why Financial Modeling Is Worth Learning
Financial modeling is useful far beyond investment banking.
A business owner can use it to forecast cash flow and avoid borrowing too late. A startup founder can use it to estimate how much funding is needed before reaching profitability. An investor can use it to understand whether a company’s expected growth supports its market valuation.
A finance student can use it to prove practical skills beyond textbook knowledge.
Consider a company with annual revenue of $10 million. It expects sales to grow 12% next year, reaching $11.2 million.
That sounds positive.
But if customers pay 10 days later than expected, more cash gets trapped in accounts receivable. If inventory also rises, the company may need a larger bank credit line despite stronger profit.
Financial modeling helps you see this before the business has a cash problem.
The Four Skills Every Beginner Should Learn First
Before building advanced models, focus on four areas.
Understand the Three Financial Statements
Every financial model begins with the income statement, balance sheet, and cash flow statement.
| Financial Statement | What It Shows | Why It Matters |
|---|---|---|
| Income Statement | Revenue, expenses, profit, taxes, and net income | Shows whether the company is profitable |
| Balance Sheet | Cash, inventory, receivables, debt, payables, and equity | Shows what the company owns and owes |
| Cash Flow Statement | Cash from operations, investments, and financing | Shows whether the company has enough cash to operate |
The basic accounting equation is:
Assets = Liabilities + Shareholders’ Equity
This equation must balance at all times.
If total assets are $5 million, then total liabilities plus equity must also equal $5 million. If they do not, something is wrong in the accounting records or the model.
Learn Core Excel Skills
You do not need to master every Excel feature before starting.
Focus first on formulas and workflows used repeatedly in finance.
| Excel Skill | Why It Matters in Financial Modeling |
|---|---|
| SUM and SUMIFS | Adds revenue, expenses, and filtered financial data |
| IF and IFERROR | Builds logic checks and prevents ugly errors |
| XLOOKUP or INDEX MATCH | Pulls assumptions and account mappings |
| Absolute Cell References | Keeps formulas stable when copied across periods |
| Excel Tables | Organizes source data and improves model readability |
| PivotTables | Summarizes large sales, expense, and accounting exports |
| Charts | Shows trends in revenue, margins, cash, and debt |
| Goal Seek | Calculates the input needed to reach a target result |
| Data Tables | Tests sensitivity to growth, margins, or interest rates |
You should know the difference between these two formulas:
=Revenue*1.12
=Revenue*(1+Growth_Rate)
The second version is better because the growth rate sits in a separate assumption cell. You can change the assumption once, and the model updates everywhere.
Learn Basic Accounting Logic
You do not need to become a certified accountant, but you should understand a few core concepts.
Revenue is not always cash received.
An expense is not always cash paid during the same period.
Depreciation reduces accounting profit but does not directly reduce cash in the year it is recorded.
Capital expenditure reduces cash immediately but appears as an asset on the balance sheet before being depreciated over time.
Debt raises cash when borrowed but creates interest expense and repayment obligations later.
These connections are what make a model work.
Learn to Make Assumptions, Not Guesses
Financial modeling is based on assumptions, but assumptions should have evidence behind them.
Weak assumption:
“Revenue will grow 30% next year.”
Better assumption:
“Revenue is expected to grow 12% because the company increased its sales force from 10 to 12 people, average revenue per salesperson is projected at $930,000, and customer churn is expected to remain near 5%.”
A model becomes more useful when the assumptions are visible, reasonable, and easy to test.
Your Beginner Financial Modeling Roadmap
A structured learning plan is better than watching random videos for months.
This eight-week plan assumes you can spend five to seven hours per week.
| Week | Main Focus | Expected Output |
|---|---|---|
| 1 | Accounting basics and financial statements | Basic understanding of income statement, balance sheet, and cash flow statement |
| 2 | Excel for finance | Formula practice, formatting, tables, shortcuts, and error checks |
| 3 | Historical analysis | Common-size income statement and financial ratios |
| 4 | Revenue and expense forecasting | Forecast assumptions and projected income statement |
| 5 | Working capital and cash flow | Receivables, inventory, payables, and cash flow schedule |
| 6 | Three-statement model | Linked income statement, balance sheet, and cash flow statement |
| 7 | Valuation basics | DCF, NPV, IRR, and sensitivity analysis |
| 8 | Real-company practice project | Completed model using a public company or private-business case |
Do not rush from Week 1 to Week 8 in two days.
Financial modeling is learned by rebuilding the same concepts repeatedly until they become familiar.
Week 1: Learn the Income Statement, Balance Sheet, and Cash Flow Statement

Start with the income statement.
A simplified income statement may look like this:
| Item | Amount |
|---|---|
| Revenue | $10.0 million |
| Cost of Goods Sold | $6.0 million |
| Gross Profit | $4.0 million |
| Operating Expenses | $2.5 million |
| EBITDA | $1.5 million |
| Depreciation | $300,000 |
| Interest Expense | $200,000 |
| Income Tax | $250,000 |
| Net Income | $750,000 |
Then understand how that net income affects the balance sheet and cash flow statement.
For example:
- Net income increases retained earnings.
- Depreciation lowers profit but is added back on the cash flow statement because it is noncash.
- Accounts receivable increase when customers have not yet paid.
- Inventory absorbs cash before products are sold.
- Debt repayment reduces cash and the debt balance.
A useful beginner exercise is to take one company’s annual report and identify each line item across all three statements.
For public companies, the SEC’s Form 10-K and Form 10-Q filings are excellent practice sources. The SEC explains that these reports provide detailed information about a company’s business, risks, operating results, and financial position.
The SEC’s EDGAR search system provides free access to company filings, including annual and quarterly reports.
Week 2: Learn Excel Like a Finance Analyst
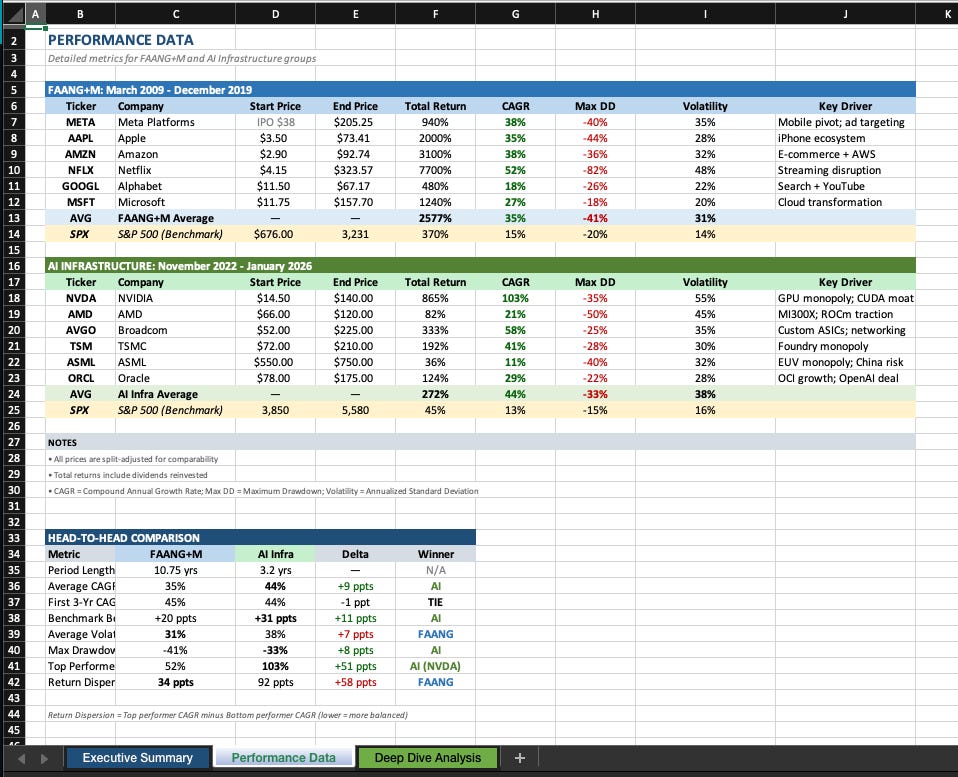
Financial modeling is not about using advanced Excel functions for the sake of it.
The goal is speed, accuracy, and transparency.
Start with these habits:
- Use one worksheet for assumptions.
- Keep historical figures separate from forecasts.
- Use consistent units, such as full dollars, thousands, lakhs, or millions.
- Label actual figures with “A” and forecast figures with “E.”
- Add a visible balance check.
- Avoid hardcoding numbers inside formulas.
- Use formulas that can be copied across years and months.
For example, a financial model might use this layout:
| Period | 2024A | 2025A | 2026E | 2027E | 2028E |
|---|---|---|---|---|---|
| Revenue Growth | 10.0% | 12.0% | 10.0% | 8.0% | |
| Revenue | $8.0m | $8.8m | $9.9m | $10.9m | $11.8m |
| Gross Margin | 38.0% | 39.0% | 40.0% | 40.0% | 40.5% |
Microsoft offers free browser-based access to Excel through Microsoft 365 for the web.
For beginner practice, this is enough. Desktop Excel becomes more useful later when you work with larger files, advanced Power Query workflows, and more complex models.
Week 3: Analyze Historical Financial Performance
Before forecasting the future, learn how to analyze the past.
Take three years of income statements and calculate:
- Revenue growth
- Gross margin
- EBITDA margin
- Net income margin
- Debt-to-EBITDA
- Current ratio
- Days sales outstanding
- Inventory days
- Interest coverage
For example:
| Metric | 2024 | 2025 | What It Suggests |
|---|---|---|---|
| Revenue | $10.0m | $11.2m | 12% growth |
| Gross Margin | 42.0% | 40.0% | Margin pressure |
| EBITDA Margin | 15.0% | 13.5% | Costs rose faster than profit |
| Days Sales Outstanding | 38 days | 46 days | Customers are paying more slowly |
| Inventory Days | 55 days | 67 days | More cash is tied up in stock |
This type of analysis tells you whether growth is actually healthy.
A company that grows revenue by 12% but sees gross margin decline and receivables rise may be creating pressure on cash flow.
Week 4: Build a Revenue and Expense Forecast

Once you understand historical performance, begin forecasting.
Start with revenue.
A simple revenue forecast can use a growth percentage:
Forecast Revenue = Prior Year Revenue × (1 + Growth Rate)
For example:
$10.0 million × 1.12 = $11.2 million
A better forecast uses business drivers.
For a subscription company:
Revenue = Active Customers × Average Monthly Revenue Per Customer × 12
For an ecommerce company:
Revenue = Website Visitors × Conversion Rate × Average Order Value
For a consulting firm:
Revenue = Consultants × Billable Hours × Hourly Rate × Utilization Rate
The more closely your forecast reflects the real business, the more useful it becomes.
Next, forecast costs.
If gross margin is expected to be 40%, then cost of goods sold equals 60% of revenue.
Cost of Goods Sold = Revenue × (1 − Gross Margin)
Using $11.2 million in revenue:
$11.2 million × 60% = $6.72 million
Gross profit equals:
$11.2 million − $6.72 million = $4.48 million
Week 5: Learn Working Capital and Cash Flow
This is where many beginners realize why financial modeling matters.
Profit does not equal cash.
Suppose a business reports net income of $945,000. That looks strong.
But the company also experiences:
- $254,000 increase in accounts receivable
- $144,000 increase in inventory
- $170,000 increase in accounts payable
- $500,000 in capital expenditure
- $300,000 in debt repayment
The increase in working capital equals:
$254,000 + $144,000 − $170,000 = $228,000
Operating cash flow becomes:
Net Income + Depreciation − Increase in Working Capital
$945,000 + $350,000 − $228,000 = $1.067 million
After $500,000 of capital expenditure and $300,000 of debt repayment, cash increases by only about $267,000.
That is a very different story from simply looking at $945,000 in net income.
Week 6: Build Your First Three-Statement Model
A three-statement model links:
- Income statement
- Balance sheet
- Cash flow statement
Start with the income statement forecast.
Then build supporting schedules for:
- Accounts receivable
- Inventory
- Accounts payable
- Fixed assets
- Depreciation
- Debt
- Interest expense
- Retained earnings
For example:
Accounts Receivable = Revenue/365*Days Sales Outstanding
Inventory = Cost of Goods Sold/365*Inventory Days
Accounts Payable = Cost of Goods Sold/365*Accounts Payable Days
Your model should include a balance check:
=Total_Assets-Total_Liabilities-Total_Equity
The answer should always equal zero.
If it does not, stop and find the problem before moving forward.
A model that does not balance may still look impressive. It is not reliable.
Week 7: Learn Valuation Basics

Once you can build a three-statement model, move to valuation.
The two most useful concepts for beginners are net present value and internal rate of return.
Net Present Value
Net present value, or NPV, estimates whether a project creates value after considering the required return.
Suppose a company invests $500,000 in a project. The project generates cash flow over five years.
A positive NPV means the project is expected to earn more than the company’s required return.
A negative NPV means the company may be better off using the money elsewhere.
Internal Rate of Return
Internal rate of return, or IRR, estimates the annual return produced by an investment.
For example, if a project has a 16% IRR and the company requires a 10% return, the project may be worth considering.
Excel functions such as NPV, XNPV, IRR, and XIRR are commonly used for this work.
Do not treat these outputs as final answers.
A model is only as good as its assumptions about revenue growth, margins, risk, cash flow timing, and discount rate.
Week 8: Build a Real Practice Project
The fastest way to improve is to complete a full project.
Choose a public company with a business model you understand. A retailer, restaurant chain, software company, manufacturer, or consumer-products company can work well.
Use the company’s annual report and quarterly filings to build:
- Three years of historical income statements
- Three years of historical balance sheets
- A simple cash flow summary
- Revenue-growth assumptions
- Gross-margin assumptions
- A three-year forecast
- Working-capital schedule
- Debt schedule
- Three-statement model
- Basic DCF valuation
Do not copy someone else’s completed model line by line.
Build it yourself first. Then compare your work against examples or professional templates.
That is where real learning happens.
The Best Practice Projects for Beginners
You do not need to spend months modeling one giant company.
Build smaller projects first.
| Project | Main Skill You Learn |
|---|---|
| Personal monthly budget model | Excel structure, formulas, cash flow tracking |
| Small-business profit forecast | Revenue, gross margin, operating expenses |
| Loan repayment schedule | PMT, interest, principal, amortization |
| Budget vs actual report | Variance analysis and reporting |
| Three-statement model | Accounting links and working capital |
| DCF valuation | Forecasting, discount rates, terminal value |
| Public-company analysis | Reading 10-K and 10-Q filings |
| Scenario analysis | Base case, upside case, and downside case planning |
A strong beginner portfolio might include three models:
- A three-statement model for a public company
- A budget versus actual report for a small business
- A DCF valuation with sensitivity analysis
That gives you more practical proof of skill than simply listing “Excel” on a résumé.
Free and Paid Financial Modeling Learning Options
You can learn financial modeling without buying a course.
Free resources are enough to understand accounting basics, Excel formulas, and the structure of a three-statement model. Public company filings through EDGAR provide real financial statements, while LibreOffice Calc offers a free spreadsheet option. LibreOffice describes Calc as a feature-rich spreadsheet for analyzing data, calculations, and visual reporting.
Paid courses become useful when you want case studies, templates, certificates, structured progression, finance-specific Excel instruction, and feedback on your models.
Financial Modeling Learning Costs
The pricing below reflects publicly displayed prices checked on July 7, 2026. Prices can change with promotions, currency conversion, GST, VAT, foreign-card fees, or region-specific offers.
| Learning Option | Current Listed Price | What You Get | Costs or Limits to Watch |
|---|---|---|---|
| Excel for the web | Free | Browser-based Excel for practice models | Fewer desktop features |
| LibreOffice Calc | Free | Offline spreadsheet software | Less standard in finance hiring environments |
| Microsoft 365 Personal | ₹6,899 per year or ₹689 per month | Desktop Excel, cloud storage, Microsoft apps | Subscription renews unless cancelled |
| Office Home 2024 | ₹10,999 one-time purchase | Desktop Excel and Office apps for one PC or Mac | No ongoing feature upgrades |
| CFI Self-Study | $397.60 promotional annual price, $497 regular | 250+ courses, certifications, templates, cases | Annual subscription and pricing may change |
| CFI Full-Immersion | $677.60 promotional annual price, $847 regular | Self-Study access plus personalized support and model feedback | Higher annual cost |
| Wall Street Prep Premium Package | $499 | Seven courses, about 45 hours 59 minutes, three-statement modeling, DCF, comps, M&A, and LBO | More investment-banking focused |
| BIWS Core Financial Modeling | $297 | Accounting, three-statement modeling, valuation, M&A, and LBO cases | Does not include all advanced or industry-specific modules |
| BIWS Excel and Financial Modeling Bundle | $397 | Excel and VBA course plus Core Financial Modeling | Higher upfront price than Core Modeling alone |
Microsoft lists Microsoft 365 Personal in India at ₹6,899 annually or ₹689 monthly. Office Home 2024 is listed at ₹10,999 as a one-time purchase.
CFI lists its Self-Study plan at $397.60 during the displayed 20% promotion, with a regular annual price of $497. Its Full-Immersion plan is displayed at $677.60 during the promotion, with a regular annual price of $847.
Wall Street Prep lists its Financial and Valuation Modeling Certification Program at $499. The program includes seven courses and approximately 45 hours and 59 minutes of material covering three-statement modeling, DCF, comparable-company analysis, M&A, and LBO modeling.
Breaking Into Wall Street lists Core Financial Modeling at $297, its Excel and Financial Modeling bundle at $397, and BIWS Premium at $497.
CFI vs Wall Street Prep vs BIWS
| Feature | CFI FMVA Path | Wall Street Prep Premium | BIWS Core Financial Modeling |
|---|---|---|---|
| Listed Price | $397.60 promotional or $497 regular annual Self-Study | $499 | $297 |
| Learning Format | Broad finance library and certification path | Structured financial-modeling program | Focused finance and investment-banking training |
| Core Topics | Three-statement models, DCF, accounting, FP&A, Excel, dashboards | Three-statement models, DCF, comps, M&A, LBO | Accounting, three-statement models, valuation, M&A, LBO |
| Stated Time Commitment | Most learners finish FMVA in roughly 100 to 120 hours | About 45 hours 59 minutes listed | Varies by pace and case-study depth |
| Feedback and Support | Full-Immersion includes personalized guidance and model feedback | Tutoring may cost extra | Course access and support depend on selected package |
| Best Fit | Broad finance, FP&A, analyst, and corporate-finance learners | Learners targeting investment banking and valuation work | Learners wanting direct modeling and interview-focused practice |
CFI is the better fit for beginners who want a wider curriculum that includes financial modeling, accounting, Excel, FP&A, dashboards, and certification exams. CFI states that its FMVA program has no formal prerequisites and that learners typically complete it in about 100 to 120 hours.
Wall Street Prep is better for learners who want a structured investment-banking-style curriculum and detailed valuation coverage.
BIWS is often the better value for a learner who wants focused Excel and financial modeling training without subscribing to a broader annual platform.
The course does not make the analyst.
Your completed models, ability to explain assumptions, and understanding of accounting will matter more than a certificate alone.
Common Beginner Mistakes
Starting With LBO Models Too Early
Leveraged buyout models are interesting because they involve debt, returns, and private equity.
They are also difficult.
Start with a simple three-statement model. You will learn more from understanding working capital and retained earnings than from copying a complex LBO template.
Memorizing Formulas Without Understanding the Business
You can memorize XIRR, NPV, and INDEX MATCH without becoming a strong modeler.
Ask what the formula represents.
Why are receivables increasing? Why is interest expense rising? Why is gross margin falling? Why does a 5% price discount require more volume to maintain profit?
That is financial analysis.
Hardcoding Numbers Everywhere
Hardcoding makes a model fragile.
Use assumption cells for revenue growth, tax rates, interest rates, working-capital days, and margin assumptions.
A reader should be able to find the key inputs quickly.
Ignoring Error Checks
Every model should have checks for:
- Balance sheet balance
- Negative cash
- Circular references
- Gross margin movement
- Debt maturity
- Interest coverage
- Unusual tax rates
- Broken formulas
A spreadsheet with no errors visible can still contain errors. Checks make mistakes easier to catch.
Treating Forecasts as Facts
A model does not predict the future.
It shows what may happen if assumptions are correct.
Always build a base case, upside case, and downside case.
For example:
| Scenario | Revenue Growth | Gross Margin | Days Sales Outstanding |
|---|---|---|---|
| Upside | 18% | 42% | 38 days |
| Base Case | 12% | 40% | 44 days |
| Downside | 3% | 37% | 55 days |
The downside case often teaches you more about risk than the upside case.
Final Strategic Verdict
Financial modeling is ideal for students, business owners, startup founders, accountants moving into finance, analysts, investors, and professionals who want to make better decisions with numbers.
Beginners should avoid expensive advanced courses until they understand the three financial statements, core Excel formulas, working capital, and a basic three-statement model.
Start with free tools, real financial statements, and small practice projects.
Move to paid training when you need structure, finance-specific case studies, portfolio-ready models, certification, or feedback from experienced instructors.
The fastest path is not watching the most videos.
It is building models, finding mistakes, fixing them, and learning why every line item affects profit, cash, debt, and business value.