
A company can report record revenue and still become financially weaker.
Imagine a business that grows sales from $16 million to $20 million in one year. Revenue is up 25%. On the surface, management has a success story.
Then you look closer.
Customers are taking 55 days to pay instead of 40. Inventory has increased by $1.2 million. Interest expense is rising because the company borrowed to support growth. Operating cash flow is only $600,000 even though net income is $1.35 million.
The company is growing, but cash is getting trapped inside the business.
Financial ratio analysis helps uncover this kind of problem. It turns raw financial statements into clear measures of profitability, liquidity, efficiency, leverage, and market value. It helps business owners understand where money is being made or lost. It helps investors compare companies. It helps lenders assess whether debt can be repaid.
A ratio is only a number. The value comes from comparing it with prior years, competitors, industry norms, and the company’s actual business model.
Key Takeaways
- Financial ratio analysis uses income-statement, balance-sheet, cash-flow, and market data to evaluate a company’s performance and financial health.
- The main ratio groups are profitability, liquidity, leverage, efficiency, cash flow, and market valuation ratios.
- Ratios should be compared across time and against similar companies. A “good” current ratio or debt level in one industry may be weak in another.
- Revenue growth alone can be misleading. Margins, cash conversion, customer collections, inventory levels, and debt coverage often matter more.
- Use average balance-sheet values for ratios such as return on assets, return on equity, receivables turnover, and inventory turnover.
- Free tools such as Excel for the web and Google Sheets are enough for basic ratio analysis. Paid accounting software becomes useful when you need automated books, reports, inventory tracking, or multi-user controls.
- Financial ratio analysis should support a decision. It should not become a spreadsheet exercise with no action attached.
What Is Financial Ratio Analysis?

Financial ratio analysis is the process of calculating relationships between numbers in a company’s financial statements.
Instead of looking only at a company’s $20 million in annual revenue, ratio analysis asks more useful questions:
- How much gross profit does the company keep from each dollar of sales?
- Is profit turning into cash?
- Can the business pay short-term obligations?
- Is debt rising faster than earnings?
- Are customers paying invoices more slowly?
- Is inventory moving efficiently?
- Is the company earning an adequate return on the money invested in it?
- Does the stock market value make sense compared with earnings?
The source data usually comes from three financial statements:
| Financial Statement | Main Information Used for Ratios |
|---|---|
| Income Statement | Revenue, cost of goods sold, operating income, interest expense, taxes, net income |
| Balance Sheet | Cash, receivables, inventory, assets, liabilities, debt, and equity |
| Cash Flow Statement | Operating cash flow, capital expenditure, debt repayments, financing activity |
| Market Data | Share price, shares outstanding, market capitalization, earnings per share |
For public companies, annual Form 10-K filings include detailed financial information and audited financial statements. Form 10-Q filings provide quarterly updates and include unaudited financial statements. Both are available through the SEC’s EDGAR system.
For private businesses, the same analysis can be performed using accounting software exports, tax returns, management accounts, bank records, payroll reports, debt statements, and inventory data.
Why Financial Ratio Analysis Matters
Financial statements contain hundreds of numbers. Ratios make them easier to interpret.
Suppose two businesses each generate $10 million in revenue.
Company A earns a 20% gross margin and $500,000 in net income.
Company B earns a 45% gross margin and $1.4 million in net income.
Revenue alone suggests the companies are similar. Ratio analysis shows they are not.
Company B keeps far more value from each sale. It may have stronger pricing power, better supplier agreements, lower labor costs, or a more attractive product mix.
Ratios also help identify danger before it appears in net income.
A company may remain profitable while receivables increase, inventory rises, and cash falls. By the time the income statement shows serious damage, the business may already be struggling to pay suppliers or lenders.
The Six Main Types of Financial Ratios
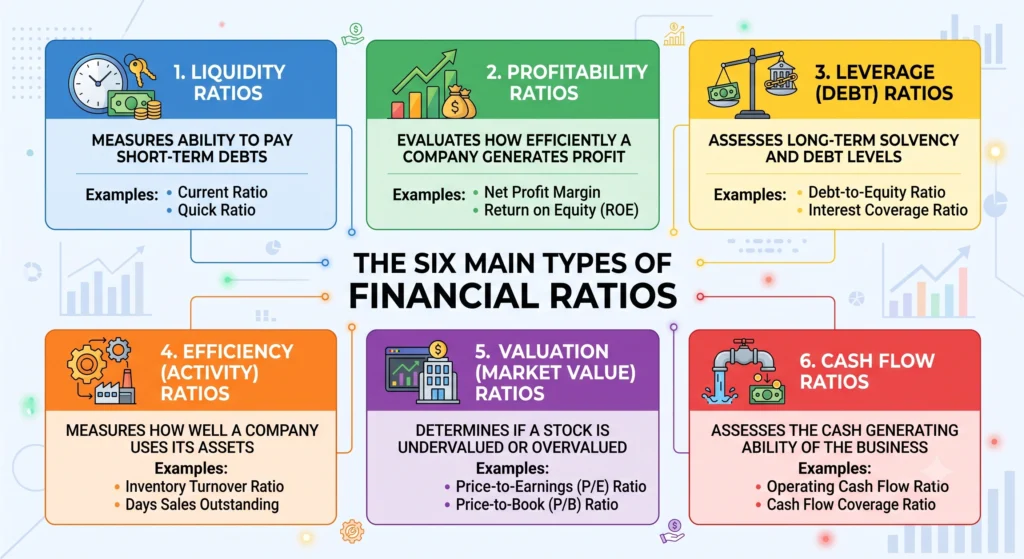
Financial ratios are usually grouped into six categories.
| Ratio Category | What It Measures | Main Question |
|---|---|---|
| Profitability Ratios | Margins and returns | Is the company making enough profit from sales and assets? |
| Liquidity Ratios | Short-term financial strength | Can the company meet upcoming obligations? |
| Leverage Ratios | Debt burden and solvency | Is debt manageable relative to earnings and equity? |
| Efficiency Ratios | Asset and working-capital use | Is the company collecting cash and using inventory efficiently? |
| Cash Flow Ratios | Profit-to-cash conversion | Does reported profit translate into usable cash? |
| Market Ratios | Public-market valuation | What are investors paying for earnings, assets, or cash flow? |
You do not need every ratio for every company.
A retailer should focus heavily on inventory days, gross margin, store productivity, and cash conversion. A software company may focus more on recurring revenue, customer churn, gross margin, and free cash flow. A manufacturer may need deeper analysis of receivables, inventory, equipment spending, and debt coverage.
Step 1: Start With a Clear Goal
Before calculating anything, decide what decision the analysis should support.
A business owner may want to know whether the company can afford to hire more people.
A lender may want to know whether the borrower can safely make interest and principal payments.
An investor may want to know whether a stock’s valuation is supported by earnings and cash flow.
A finance manager may want to know why operating cash flow declined despite rising profit.
Your goal determines which ratios matter most.
| Goal | Ratios That Deserve Priority |
|---|---|
| Check profitability | Gross margin, operating margin, net margin, return on assets |
| Check liquidity | Current ratio, quick ratio, operating cash flow, cash conversion |
| Review debt risk | Debt to equity, debt to EBITDA, interest coverage |
| Improve collections | Receivables turnover, days sales outstanding |
| Control inventory | Inventory turnover, inventory days |
| Evaluate a public stock | P/E ratio, price to book, free cash flow yield, return on equity |
| Assess a new project | Return on investment, NPV, IRR, payback period |
A ratio without a decision behind it often becomes a reporting distraction.
Step 2: Collect Consistent Financial Data
Use at least two years of data. Three to five years is better.
One year shows a snapshot. Several years show a trend.
You should collect:
- Revenue
- Cost of goods sold
- Operating expenses
- EBIT or operating income
- EBITDA, if available
- Interest expense
- Net income
- Cash
- Accounts receivable
- Inventory
- Accounts payable
- Current assets and liabilities
- Total assets
- Total debt
- Shareholders’ equity
- Operating cash flow
- Capital expenditure
Use the same accounting period for all figures.
Do not compare a full twelve months of revenue with a balance-sheet figure from the middle of the year unless you are intentionally using a trailing-twelve-month method.
For turnover and return ratios, use average balance-sheet values when possible:
Average Balance = (Beginning Balance + Ending Balance) ÷ 2
This produces a more realistic result because the income statement covers an entire period, while a balance sheet only captures one date.
Step 3: Normalize the Numbers Before Calculating Ratios
Financial statements may contain one-time items that make ratios misleading.
Examples include:
- A large legal settlement
- A business acquisition
- Sale of a building
- Restructuring costs
- Major inventory write-down
- One-time tax benefit
- Pandemic-related grant or subsidy
- Insurance recovery
- Unusual owner compensation in a private company
Suppose a company earns $900,000 in net income, but $350,000 came from selling unused land.
The reported net margin may look strong. The operating business may be much weaker than the ratio suggests.
A clean analysis separates recurring operating performance from unusual gains or losses.
You should also confirm whether the company uses different accounting policies from peers. Revenue recognition, depreciation methods, inventory accounting, lease treatment, and adjusted EBITDA policies can affect comparability.
Step 4: Calculate Profitability Ratios
Profitability ratios show how effectively a company turns sales, assets, and shareholder capital into earnings.
Gross Margin
Gross margin shows the percentage of revenue left after direct production or product costs.
Gross Margin = Gross Profit ÷ Revenue
If a company has $20 million in revenue and $12.6 million in cost of goods sold:
Gross Profit = $20.0 million − $12.6 million = $7.4 million
Gross Margin = $7.4 million ÷ $20.0 million = 37.0%
A declining gross margin may signal higher supplier costs, discounting, weak pricing power, unfavorable product mix, higher shipping costs, or operational inefficiency.
Operating Margin
Operating margin measures profit from core business operations before interest and taxes.
Operating Margin = EBIT ÷ Revenue
If EBIT equals $2.2 million:
Operating Margin = $2.2 million ÷ $20.0 million = 11.0%
Gross margin shows whether the company makes enough on each sale. Operating margin shows whether it controls overhead, payroll, sales, marketing, and administrative costs.
Net Margin
Net margin shows the percentage of revenue remaining after all expenses, interest, and taxes.
Net Margin = Net Income ÷ Revenue
If net income equals $1.35 million:
Net Margin = $1.35 million ÷ $20.0 million = 6.75%
A company can have a healthy gross margin and a weak net margin if debt, taxes, overhead, or non-operating costs are too high.
Return on Assets
Return on assets, or ROA, measures how efficiently the company uses its asset base to generate profit.
ROA = Net Income ÷ Average Total Assets
If net income is $1.35 million and average total assets equal $13.5 million:
ROA = $1.35 million ÷ $13.5 million = 10.0%
A higher ROA often suggests stronger asset efficiency, but it must be compared with companies that have similar business models. A software company may have relatively few physical assets. A manufacturer may need expensive machinery and factories.
Return on Equity
Return on equity, or ROE, measures the return generated on shareholder capital.
ROE = Net Income ÷ Average Shareholders’ Equity
If average equity is $5.3 million:
ROE = $1.35 million ÷ $5.3 million = 25.5%
A high ROE can be attractive, but it can also be boosted by heavy debt. Always compare ROE with debt-to-equity and interest-coverage ratios.
Step 5: Calculate Liquidity Ratios
Liquidity ratios show whether a company has enough short-term resources to meet bills, payroll, taxes, and loan obligations.
Current Ratio
Current Ratio = Current Assets ÷ Current Liabilities
Suppose the company has:
- Cash: $900,000
- Accounts receivable: $3.0 million
- Inventory: $2.4 million
- Current liabilities: $4.0 million
Current Ratio = ($0.9m + $3.0m + $2.4m) ÷ $4.0m
Current Ratio = 1.58
That means the company has $1.58 of current assets for every $1.00 of current liabilities.
There is no universal “safe” current ratio. Grocery stores may operate with lower ratios because inventory turns quickly and customers pay immediately. Construction companies may require more liquidity because customers pay slowly and projects consume cash before billing occurs.
Quick Ratio
The quick ratio removes inventory because inventory may not convert into cash quickly.
Quick Ratio = (Cash + Marketable Securities + Accounts Receivable) ÷ Current Liabilities
Using the same example:
Quick Ratio = ($0.9m + $3.0m) ÷ $4.0m
Quick Ratio = 0.98
The company has less than $1 of quick assets for every $1 of current liabilities.
That does not automatically mean the business is in trouble. It does mean management should review cash collections, debt maturities, supplier terms, and inventory quality.
Step 6: Calculate Leverage and Debt Ratios

Debt can help a company grow. It can also become dangerous when earnings weaken.
Debt to Equity
Debt to Equity = Total Debt ÷ Shareholders’ Equity
If total debt equals $6.8 million and equity equals $5.6 million:
Debt to Equity = $6.8 million ÷ $5.6 million = 1.21
The business has $1.21 of debt for every $1.00 of equity.
A higher ratio is not always bad. Utility companies, real estate firms, and capital-intensive businesses may use more debt than software or consulting firms. The question is whether earnings and cash flow can support it.
Debt to EBITDA
Debt to EBITDA = Total Debt ÷ EBITDA
If EBITDA is $2.7 million:
Debt to EBITDA = $6.8 million ÷ $2.7 million = 2.52x
This ratio estimates how many years of EBITDA would equal the company’s debt balance, before considering taxes, capital expenditure, working capital, and distributions.
A 2.5x debt-to-EBITDA ratio may be manageable for a stable company with recurring cash flow. It may be risky for a cyclical company with volatile margins.
Interest Coverage Ratio
Interest Coverage = EBIT ÷ Interest Expense
If EBIT equals $2.2 million and interest expense equals $850,000:
Interest Coverage = $2.2 million ÷ $850,000 = 2.59x
The company earns about $2.59 of operating profit for every $1.00 of interest expense.
A falling interest coverage ratio is often an early warning sign. Higher borrowing rates, lower operating profit, or additional debt can quickly reduce the margin of safety.
Step 7: Measure Efficiency and Working Capital

Efficiency ratios show how well the company uses its assets and manages working capital.
Days Sales Outstanding
Days sales outstanding, or DSO, estimates how long customers take to pay invoices.
DSO = Accounts Receivable ÷ Revenue × 365
If accounts receivable are $3 million and revenue is $20 million:
DSO = $3.0 million ÷ $20.0 million × 365
DSO = 54.8 days
If DSO was 40 days last year and is now nearly 55 days, the company is collecting cash about two weeks later.
That extra delay can tie up a large amount of cash.
On $20 million in annual sales, a 15-day collection delay represents roughly:
$20 million ÷ 365 × 15 = about $822,000
That cash may need to be replaced with borrowing or delayed supplier payments.
Inventory Turnover and Inventory Days
Inventory Turnover = Cost of Goods Sold ÷ Average Inventory
Inventory Days = 365 ÷ Inventory Turnover
If inventory equals $2.4 million and cost of goods sold equals $12.6 million:
Inventory Turnover = $12.6 million ÷ $2.4 million = 5.25x
Inventory Days = 365 ÷ 5.25 = 69.5 days
Higher inventory days can indicate excess stock, falling demand, supply-chain planning issues, or seasonal buying. Low inventory days can be positive, but may also create stockout risk.
Asset Turnover
Asset Turnover = Revenue ÷ Average Total Assets
If revenue is $20 million and average assets are $13.5 million:
Asset Turnover = $20.0 million ÷ $13.5 million = 1.48x
The company generates $1.48 in revenue for every $1.00 invested in average assets.
This is especially useful when comparing companies in the same industry.
Step 8: Check Whether Profit Is Turning Into Cash

Profit is not cash.
A company may show strong net income while cash flow falls because receivables, inventory, capital expenditure, debt repayment, or tax payments absorb cash.
Operating Cash Flow Margin
Operating Cash Flow Margin = Operating Cash Flow ÷ Revenue
If operating cash flow is $600,000:
Operating Cash Flow Margin = $600,000 ÷ $20.0 million = 3.0%
The company’s net margin is 6.75%, but operating cash flow margin is only 3.0%.
That difference deserves investigation.
Cash Conversion Ratio
Cash Conversion Ratio = Operating Cash Flow ÷ Net Income
Cash Conversion Ratio = $600,000 ÷ $1.35 million = 44.4%
The company converted only 44.4% of net income into operating cash flow.
A single weak year may be temporary. A multi-year decline can signal that profits are less reliable than they appear.
Free Cash Flow
Free Cash Flow = Operating Cash Flow − Capital Expenditure
If operating cash flow is $600,000 and capital expenditure is $750,000:
Free Cash Flow = $600,000 − $750,000 = negative $150,000
The business is profitable, but it is still consuming cash after investment needs.
That may be acceptable if the capital expenditure supports future growth. It may be a warning sign if the spending is recurring just to maintain operations.
Step 9: Use Market Ratios for Public Companies
Market ratios are only relevant when a company has publicly traded shares or a reliable estimated market value.
Price-to-Earnings Ratio
P/E Ratio = Share Price ÷ Earnings Per Share
Investor.gov describes the P/E ratio as a way to compare a company’s share price with earnings per share.
A high P/E ratio can mean investors expect strong future growth. It can also mean the stock is expensive relative to current earnings.
A low P/E ratio can mean the stock is undervalued. It can also mean investors expect profits to decline.
P/E should never be used alone. Compare it with revenue growth, margin trend, debt, cash flow, industry conditions, and the company’s own history.
A Worked Financial Ratio Analysis Example
Consider a fictional company called Northstar Components.
| Metric | Prior Year | Current Year |
|---|---|---|
| Revenue | $16.0 million | $20.0 million |
| Gross Margin | 40.0% | 37.0% |
| Operating Margin | 12.5% | 11.0% |
| Net Margin | 7.5% | 6.75% |
| Days Sales Outstanding | 40 days | 54.8 days |
| Inventory Days | 58 days | 69.5 days |
| Debt to EBITDA | 1.8x | 2.52x |
| Interest Coverage | 4.2x | 2.59x |
| Operating Cash Flow | $1.1 million | $600,000 |
| Net Income | $1.2 million | $1.35 million |
Revenue increased by 25%.
But nearly every quality measure worsened.
Gross margin fell from 40% to 37%. DSO increased by almost 15 days. Inventory days increased by more than 11 days. Debt rose faster than EBITDA. Interest coverage fell. Operating cash flow declined even though net income increased.
The correct conclusion is not “the company is failing.”
The correct conclusion is that growth is consuming cash and weakening the company’s margin of safety.
Management should investigate four areas:
| Issue | Likely Cause | Recommended Action |
|---|---|---|
| Falling gross margin | Discounting, higher supplier costs, product mix | Review pricing, supplier contracts, and low-margin products |
| Rising DSO | Weak collections or longer customer terms | Review overdue invoices and credit policy |
| Higher inventory days | Overstocking or slower demand | Identify slow-moving items and adjust purchasing |
| Lower interest coverage | Higher borrowing or lower operating profit | Review refinancing, debt paydown, and spending controls |
That is financial ratio analysis at its best. It identifies what changed and where management should act.
How to Compare Ratios Properly
Ratios become useful when compared in three ways.
Compare With Prior Periods
Track ratios monthly, quarterly, and annually.
A gross margin of 37% may look acceptable by itself. A fall from 45% to 37% in two years signals a serious issue.
Compare With Similar Companies
Compare companies in the same sector, with similar size, geography, customer base, and business model.
Comparing a grocery chain with a software company is rarely useful. Grocery retailers may have thin margins but fast inventory turnover. Software companies may have higher gross margins but spend heavily on sales and research.
Compare With Management Targets
A business should compare ratios with its own targets.
For example:
| Metric | Target | Actual | Result |
|---|---|---|---|
| Gross Margin | 40.0% | 37.0% | Below target |
| DSO | 42 days | 54.8 days | Below target |
| Inventory Days | 60 days | 69.5 days | Below target |
| Interest Coverage | 3.5x | 2.59x | Below target |
This creates accountability. The numbers become part of a plan rather than a historical report.
What Does Financial Ratio Analysis Cost?
Financial ratio analysis itself has no transaction fee. The cost depends on the tools you use, the quality of your accounting records, and whether you need automated reporting, market data, or outside professional review.
The prices below are U.S. list prices checked on July 7, 2026. Promotional pricing, taxes, regional pricing, data add-ons, and third-party payment fees can change the total paid.
| Tool or Cost Factor | Published Price | Best Use | Important Cost Detail |
|---|---|---|---|
| Excel for the web | Free | Basic ratio calculations, templates, and personal analysis | Browser-based version with fewer advanced desktop features |
| Microsoft 365 Personal | $9.99 per month or $99.99 per year | Desktop Excel, PivotTables, Power Query, detailed models | Subscription renews unless cancelled |
| Google Sheets | Free with a Google account | Shared basic analysis and team collaboration | Best for light to moderate spreadsheet work |
| Google Workspace Business Starter | $7 per user per month with annual commitment, or $8.40 flexible | Business email, Sheets, shared reporting | Annual plan has a one-year commitment |
| QuickBooks Online Simple Start | $38 per month regular price | Small-business books and basic reports | Currently displayed with 50% off for three months |
| QuickBooks Online Essentials | $75 per month regular price | Multi-user access and enhanced billing/reporting | Currently displayed with 50% off for three months |
| QuickBooks Online Plus | $115 per month regular price | Inventory and project profitability tracking | Currently displayed with 50% off for three months |
| QuickBooks Online Advanced | $275 per month regular price | Larger teams and advanced business reporting | Currently displayed with 50% off for three months |
| Professional accountant or analyst review | Quote-based | Lending, acquisition, investor, or board-level analysis | Cost rises with complexity and data cleanup needs |
| Market-data subscriptions | Quote-based | Public-company peer analysis and valuation multiples | Usually unnecessary for a small private-business review |
Microsoft states that Microsoft 365 for the web is free in a browser with a Microsoft account. Its U.S. list price for Microsoft 365 Personal is $9.99 monthly or $99.99 annually.
Google lists Workspace Business Starter at $7 per user each month with an annual commitment or $8.40 per user monthly on flexible billing.
QuickBooks currently lists regular monthly prices of $38 for Simple Start, $75 for Essentials, $115 for Plus, and $275 for Advanced, with a displayed 50% discount for the first three months. Intuit also notes that optional payment services can create separate transaction charges, including a listed $0.50 standard ACH fee above monthly allotments in some cases.
The biggest hidden cost is often poor data. If bank accounts are unreconciled, receivables are inaccurate, inventory is overstated, or expenses are coded inconsistently, no ratio dashboard will produce a trustworthy conclusion.
Excel vs Google Sheets vs QuickBooks for Ratio Analysis
| Feature | Excel | Google Sheets | QuickBooks Online |
|---|---|---|---|
| Starting Cost | Free on web, paid desktop options | Free with a Google account | Starts at $38 per month regular price |
| Best For | Detailed analysis, custom models, investor work | Collaborative team analysis and lightweight dashboards | Small-business bookkeeping and standard reports |
| Data Entry | Usually imported manually or through connections | Usually imported manually or through connections | Captures and organizes accounting transactions |
| Ratio Flexibility | Excellent | Good | Moderate without exporting data |
| Advanced Modeling | Excellent | Good for moderate complexity | Limited compared with spreadsheets |
| Inventory Analysis | Custom-built | Custom-built | Available on Plus and higher plans |
| Collaboration | Good with OneDrive and SharePoint | Excellent live collaboration | Strong role-based business access |
| Best Fit | Analysts, investors, finance teams | Startups and collaborative teams | Owners who need clean books before ratio analysis |
Excel wins when you need detailed custom analysis, multi-year ratio trends, financial models, sensitivity tables, peer comparisons, and presentation-ready dashboards.
Google Sheets wins when several people need to edit a simple report at the same time. It is a practical choice for small teams that value collaboration over advanced modeling features.
QuickBooks wins when the bigger problem is not analysis but bookkeeping. A clean accounting system can automatically produce standard reports and reduce the time required to assemble data for ratio analysis. Its Plus plan includes inventory tracking, which may matter for product businesses.
Common Financial Ratio Analysis Mistakes
Looking at One Ratio in Isolation
A high return on equity may look attractive until you discover that the company has excessive debt.
A low current ratio may look dangerous until you find that the company sells inventory quickly for cash.
Ratios must be interpreted together.
Comparing Different Industries
A supermarket, consulting firm, bank, airline, software company, and manufacturer should not be judged against one generic benchmark.
Business models determine what ratios matter.
Using Ending Balances Instead of Average Balances
Using only year-end receivables or assets can distort return and turnover ratios.
Use average balances when the data is available.
Ignoring Cash Flow
A company may show a healthy net margin while cash flow deteriorates.
Always compare operating cash flow with net income and review working-capital changes.
Ignoring One-Time Events
A large asset sale, legal settlement, acquisition, or tax adjustment can make a ratio look much better or worse than normal.
Normalize the numbers before drawing conclusions.
Treating a Ratio as a Final Decision
Ratios identify questions. They do not replace due diligence.
A low gross margin may require a review of pricing, suppliers, customer contracts, product mix, labor costs, and competitors before management decides what to do.
Final Strategic Verdict
Financial ratio analysis is ideal for business owners, finance managers, investors, lenders, founders, and students who need to understand whether a company is truly becoming stronger or weaker.
It is especially useful when revenue is growing but cash feels tight, when debt is rising, when margins are under pressure, or when management needs evidence before making a hiring, borrowing, pricing, or investment decision.
Small businesses should begin with gross margin, net margin, current ratio, DSO, inventory days, debt to EBITDA, interest coverage, and operating cash flow.
Investors should add return on equity, return on assets, free cash flow, valuation multiples, and peer comparisons.
Avoid using ratio analysis as the only basis for a major decision when the company has poor records, major one-time events, early-stage losses, unusual accounting policies, or no meaningful peer group. In those situations, ratios should be supported by deeper cash-flow analysis, industry research, and professional review.
The strongest financial ratio analysis does not produce the most metrics.
It explains how profit, cash, working capital, and debt are moving together, then gives the reader a clear reason to act.