
Finance teams have always used Excel to answer expensive questions.
Can the company afford a new factory? What happens if revenue grows 12% but gross margin falls by 3 percentage points? How much cash will remain if customers pay 15 days late? Is a startup’s valuation reasonable? Should a business borrow money, raise equity, or delay expansion?
The problem is not that Excel lacks power. The problem is that financial modeling is slow, manual, and easy to break.
A single wrong formula can distort EBITDA, debt repayment, cash flow, or valuation. A messy workbook can hide mistakes. A model built by one analyst may be hard for another person to audit. AI financial modeling in Excel is changing that workflow.
AI financial modeling in Excel means using artificial intelligence tools, such as Microsoft Copilot, Python in Excel, ChatGPT, Gemini, or AI spreadsheet apps, to help build, test, analyze, explain, and improve financial models. The goal is not to replace finance judgment. The goal is to speed up repetitive work, make models easier to review, and help analysts identify patterns, risks, and errors faster.
Used correctly, AI can help you create formulas, build assumptions, summarize financial statements, generate scenario tables, identify outliers, explain variances, and draft management commentary. Used carelessly, it can also create false confidence, wrong formulas, and unsupported assumptions.
Key Takeaways
- AI financial modeling in Excel uses tools such as Copilot, Python in Excel, ChatGPT, and other AI assistants to support forecasting, budgeting, valuation, variance analysis, and reporting.
- Microsoft says Copilot in Excel can help build and edit workbooks using tables, charts, PivotTables, and formulas, while keeping workbook content editable and under user control.
- AI is useful for drafting formulas, cleaning data, building scenarios, writing explanations, and spotting outliers, but it should not be trusted blindly for high-stakes finance decisions.
- The best AI-assisted model still needs clean source data, transparent assumptions, clear checks, and human review.
- Microsoft 365 Personal in India is listed at ₹6,899 per year or ₹689 per month, while Microsoft 365 Premium is listed at ₹19,999 per year or ₹1,999 per month. Office Home 2024 is listed at ₹10,999 as a one-time purchase.
- Business users may need Microsoft 365 plans with Copilot. Microsoft’s India business pricing page lists Business Standard with Copilot at ₹1,955 per user per month on annual billing, with GST extra.
- AI financial modeling is best for analysts, founders, FP&A teams, business owners, investors, and CFOs who understand finance basics and want faster, better documented models.
What Is AI Financial Modeling in Excel?
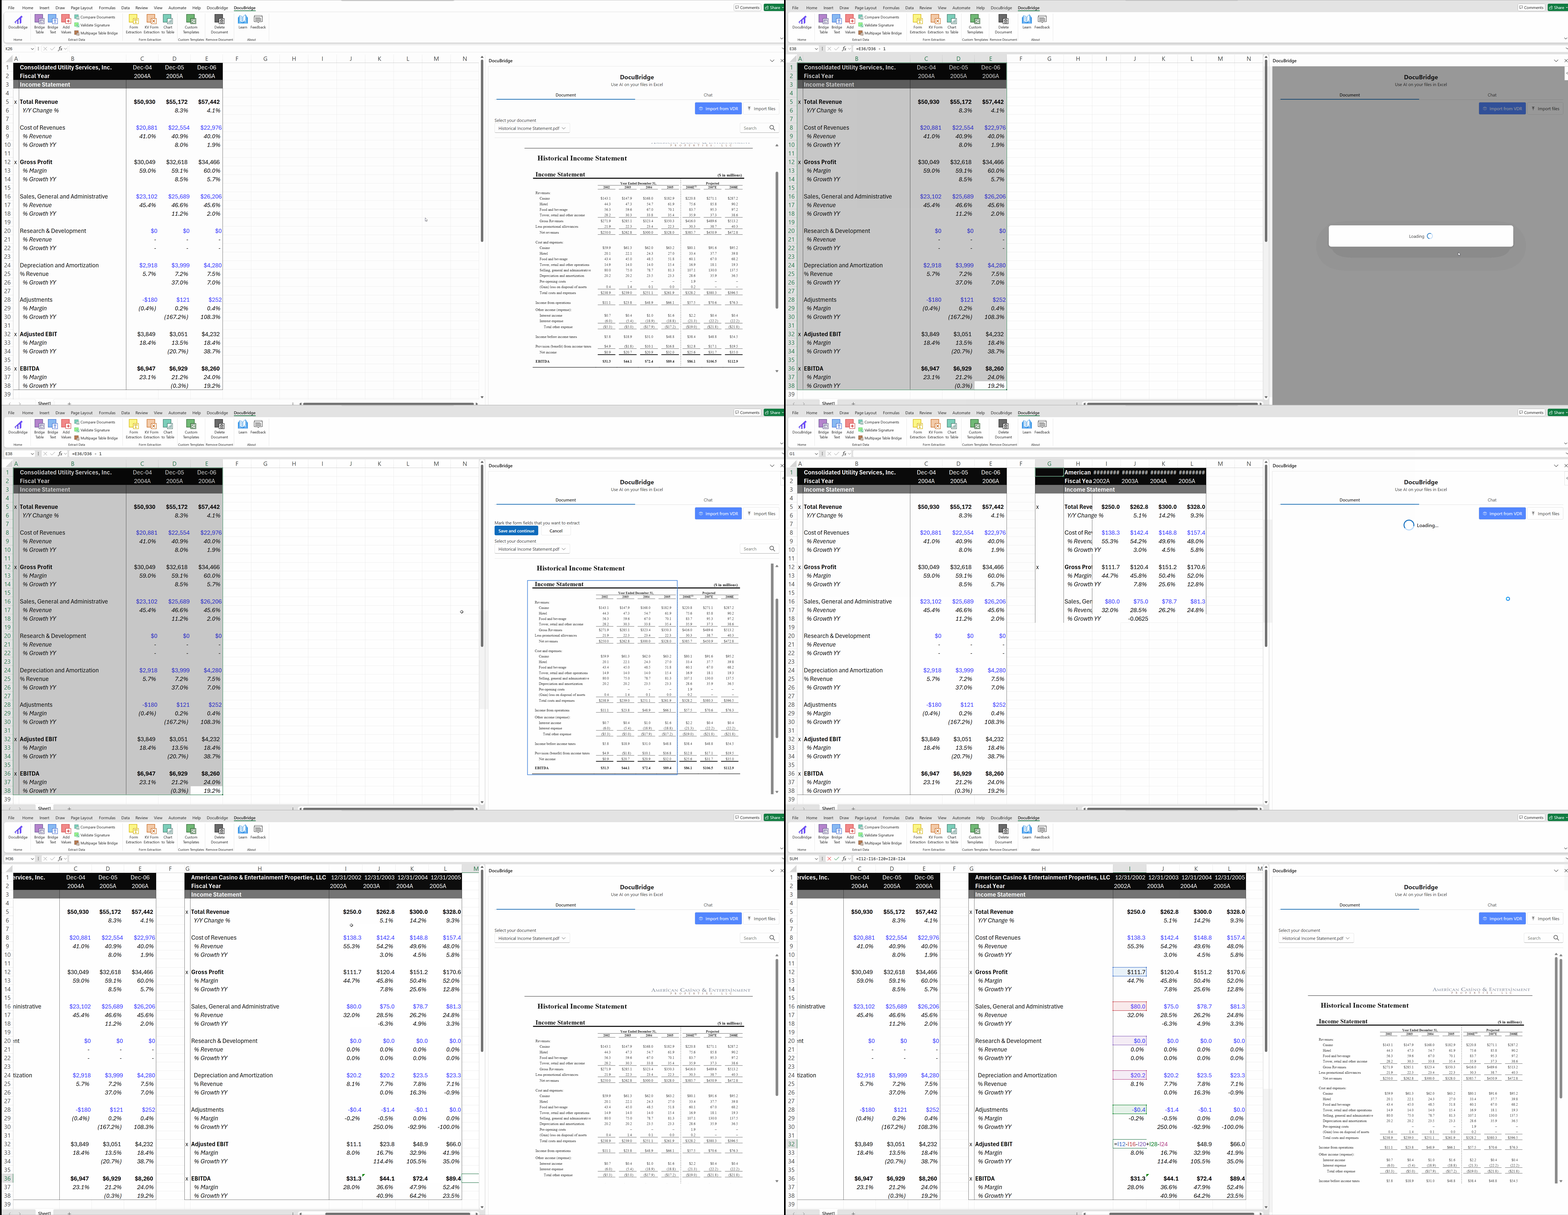
AI financial modeling in Excel is the use of artificial intelligence inside or alongside Excel to help create and analyze finance models.
A traditional financial model may include:
- Historical income statements
- Balance sheets
- Cash flow statements
- Revenue forecasts
- Cost assumptions
- Working capital schedules
- Debt schedules
- Capital expenditure forecasts
- Discounted cash flow valuation
- Scenario analysis
- Sensitivity tables
- Budget vs actual reports
- Variance analysis
- Management dashboards
AI can support many of these steps.
For example, instead of manually writing every formula, an analyst can ask AI:
“Create a formula to forecast revenue using prior year revenue and a growth rate assumption.”
“Build a sensitivity table for EBITDA based on revenue growth and gross margin.”
“Explain why free cash flow is negative even though net income is positive.”
“Summarize the key financial risks from this annual report.”
“Create a PivotTable showing revenue by region and month.”
Microsoft says Copilot in Excel can help users build and edit workbooks, create charts and PivotTables, identify insights, and apply sorting, filtering, and conditional formatting.
The important point is control. AI should support the finance professional, not silently replace the model logic.
A model used for lending, fundraising, valuation, board reporting, or investment decisions still needs human review.
Why AI Matters in Financial Modeling

Financial modeling has three big pain points.
First, it takes time.
Second, it is prone to errors.
Third, many models are hard to explain.
AI can help with all three, but only when the user gives clear instructions and validates the output.
AI Can Reduce Manual Setup Time
A beginner may spend 30 minutes writing formulas for revenue growth, gross margin, operating expenses, working capital, and cash flow.
AI can draft the structure much faster.
For example, you might ask:
“Create a three-year forecast layout with revenue, gross profit, EBITDA, depreciation, interest, tax, net income, operating cash flow, capital expenditure, and free cash flow.”
The output still needs checking. But the blank-page problem becomes easier.
AI Can Help Explain the Numbers
A finance model should not only calculate. It should explain.
Suppose revenue increased by 14%, but operating cash flow fell by 22%.
A finance analyst can ask AI to help structure the explanation:
“Explain why operating cash flow may fall even when revenue and net income increase. Use accounts receivable, inventory, and payables.”
The analyst must then compare the explanation with actual data.
This is useful for monthly management reports, board decks, investor notes, lender reporting, and budget reviews.
AI Can Improve Data Analysis
Copilot in Excel can return insights as charts, PivotTables, summaries, trends, or outliers when users ask questions about their data. Microsoft also notes that specific questions and named columns produce more useful answers.
That matters because finance teams often spend too much time preparing data and too little time interpreting it.
A useful AI prompt might be:
“Find the three largest unfavorable expense variances and show them as a table.”
“Create a PivotTable showing actual revenue by region, product, and month.”
“Identify months where gross margin was more than 2 percentage points below budget.”
These tasks are not complicated, but they are repetitive. AI can reduce the time needed to get to the first version of the analysis.
What AI Can Do Inside Excel

AI is most useful when applied to specific finance tasks.
1. Build Model Structures
AI can draft a model layout.
For example, you can ask:
“Create a financial model structure for a SaaS business with revenue, churn, customer acquisition cost, gross margin, operating expenses, EBITDA, cash burn, and runway.”
A good first layout may include:
| Section | Purpose |
|---|---|
| Assumptions | Growth rates, pricing, churn, margins, headcount, tax rate |
| Historical Financials | Past income statement, balance sheet, and cash flow |
| Revenue Forecast | Customers, price, retention, upsells, new sales |
| Cost Forecast | COGS, payroll, marketing, software, rent |
| Working Capital | Receivables, payables, inventory, deferred revenue |
| Debt Schedule | Borrowing, repayment, interest expense |
| Cash Flow | Operating cash flow, capital spending, financing |
| Valuation | DCF, multiples, sensitivity analysis |
| Dashboard | Summary charts, ratios, KPIs, and alerts |
The analyst should then decide whether that structure fits the business.
A SaaS model is different from a retail model. A manufacturing model is different from a consulting model. AI can start the workbook, but the business logic must come from the user.
2. Generate and Check Formulas
AI can help create formulas for financial modeling.
Examples include:
=Prior_Year_Revenue*(1+Growth_Rate)
=Revenue*Gross_Margin
=EBIT*(1-Tax_Rate)+Depreciation-Capex-Change_in_Working_Capital
=IF(Debt_Balance>0,Debt_Balance*Interest_Rate,0)
AI can also explain what a formula is doing in plain English.
This is useful for beginners who understand the financial concept but struggle with Excel syntax.
Still, formula review is mandatory.
A formula can be technically valid and financially wrong. For example, interest expense based on ending debt instead of average debt may distort the model. Working capital formulas can also be reversed easily.
3. Build Scenarios and Sensitivity Tables
Financial models should not rely on one forecast.
AI can help create a base case, upside case, and downside case.
| Scenario | Revenue Growth | Gross Margin | DSO | EBITDA Margin |
|---|---|---|---|---|
| Upside | 18% | 44% | 40 days | 18% |
| Base Case | 10% | 40% | 50 days | 14% |
| Downside | 2% | 35% | 65 days | 7% |
A good prompt might be:
“Create three financial modeling scenarios for a manufacturing business. Include revenue growth, gross margin, receivable days, inventory days, and EBITDA margin assumptions.”
This helps management see what happens if sales slow, margins fall, or cash collections weaken.
4. Analyze Variance and Outliers
Variance analysis compares actual results with budget or forecast.
AI can help summarize the biggest changes.
Example prompt:
“Compare actual and budget columns. Identify the top five unfavorable variances by rupee amount and explain possible causes.”
Copilot can help highlight, sort, filter, create charts, and build PivotTables to bring important data forward. Microsoft says users should review, edit, and verify anything AI creates.
That warning matters.
AI may identify the largest variances correctly, but it may not know the business reason. It can suggest likely causes. The finance team must confirm them with the sales, operations, payroll, or accounting teams.
5. Summarize Financial Statements
AI can help summarize income statements, balance sheets, and cash flow statements.
For public companies, the SEC’s EDGAR database provides free public access to corporate information, including periodic reports filed on Forms 10-K and 10-Q.
A finance analyst can use AI to support the first review of filings:
“Summarize revenue growth, gross margin, operating margin, debt, and free cash flow from this annual report.”
“Find risk factors related to customer concentration, debt, litigation, and supply chain.”
“Extract the last three years of revenue, operating income, net income, total assets, total debt, and operating cash flow.”
The output should be checked against the source filing.
For investment analysis, do not rely on AI summaries alone. Always verify numbers in the original filing.
6. Use Python in Excel for More Advanced Analysis
Python in Excel allows analysts to use Python inside Excel for data analysis and visualization.
Microsoft says Python in Excel includes a core set of Python libraries provided by Anaconda and can help simplify data analysis, find patterns, and visualize data with plots. Microsoft also states that Python in Excel requires internet access and is available in Excel for Windows, Excel on the web, and Excel for Mac, but not on Excel for iPad, iPhone, or Android.
This can be useful for:
- Regression analysis
- Monte Carlo simulation
- Data cleaning
- Forecast testing
- Outlier detection
- Time series analysis
- Statistical charts
- Scenario distributions
Microsoft notes that qualifying Microsoft 365 subscribers get limited access to premium Python compute each month, and users can purchase an add-on license for full access to premium compute.
Python in Excel is not required for beginner financial modeling. But it can be useful for analysts dealing with larger datasets or statistical work.
A Practical AI Financial Modeling Workflow in Excel

A clean AI-assisted workflow should look like this.
Step 1: Start With Clean Source Data
Do not ask AI to analyze messy data and expect a reliable answer.
Prepare your data first.
Your source table should include clear column names such as:
| Date | Account | Department | Budget | Actual | Region | Product | Customer |
|---|
Remove blank rows, merged cells, inconsistent dates, duplicate headers, and unexplained manual notes.
AI works better when the table is structured.
Step 2: Create an Assumptions Sheet
Every financial model should have one clear assumptions section.
| Assumption | Base Case |
|---|---|
| Revenue Growth | 10% |
| Gross Margin | 40% |
| Payroll Growth | 8% |
| Tax Rate | 25% |
| DSO | 50 days |
| Inventory Days | 65 days |
| Capex as % of Revenue | 4% |
| Interest Rate | 11% |
Ask AI to help organize the assumptions, but keep the final logic under your control.
Step 3: Build the Model Line by Line
Use AI to support formula writing, not to create an invisible black box.
A model should be easy to audit.
For example:
| Line Item | Formula Logic |
|---|---|
| Revenue | Prior year revenue multiplied by one plus growth rate |
| Gross Profit | Revenue multiplied by gross margin |
| EBITDA | Gross profit minus operating expenses |
| Accounts Receivable | Revenue divided by 365 multiplied by DSO |
| Inventory | COGS divided by 365 multiplied by inventory days |
| Accounts Payable | COGS divided by 365 multiplied by payable days |
| Free Cash Flow | Operating cash flow minus capital expenditure |
A user should be able to trace every number.
Step 4: Add Checks
Every model needs checks.
Examples:
| Check | Formula Logic |
|---|---|
| Balance Sheet Check | Assets minus liabilities minus equity should equal zero |
| Negative Cash Check | Flags if cash balance falls below zero |
| Margin Check | Flags if gross margin changes by more than 5 percentage points |
| Debt Check | Flags if debt becomes negative |
| Interest Coverage Check | EBIT divided by interest expense |
| Formula Consistency Check | Reviews whether formulas are copied consistently across periods |
AI can suggest checks, but the analyst must test them.
Step 5: Use AI for Commentary
After the model is complete, AI can help draft commentary.
Example prompt:
“Write a management summary explaining why EBITDA improves from ₹2 crore to ₹2.8 crore, while free cash flow stays flat because inventory and receivables increase.”
A strong answer should mention:
- Revenue growth
- Gross margin movement
- Operating expense control
- Working capital pressure
- Capital expenditure
- Debt or interest costs
- Cash impact
This is where AI can save time, especially for board packs and investor updates.
Worked Example: AI-Assisted Forecast in Excel
Assume a company had ₹10 crore in revenue last year.
Management expects:
- Revenue growth of 12%
- Gross margin of 38%
- Operating expenses of ₹2.7 crore
- Depreciation of ₹40 lakh
- Interest expense of ₹25 lakh
- Tax rate of 25%
- Capex of ₹60 lakh
- Increase in working capital of ₹35 lakh
Forecast revenue:
₹10 crore × 1.12 = ₹11.2 crore
Gross profit:
₹11.2 crore × 38% = ₹4.256 crore
EBITDA:
₹4.256 crore − ₹2.7 crore = ₹1.556 crore
EBIT:
₹1.556 crore − ₹0.40 crore = ₹1.156 crore
Profit before tax:
₹1.156 crore − ₹0.25 crore = ₹0.906 crore
Tax:
₹0.906 crore × 25% = ₹0.2265 crore
Net income:
₹0.906 crore − ₹0.2265 crore = ₹0.6795 crore
Operating cash flow:
Net income + depreciation − increase in working capital
₹0.6795 crore + ₹0.40 crore − ₹0.35 crore = ₹0.7295 crore
Free cash flow:
₹0.7295 crore − ₹0.60 crore = ₹0.1295 crore
The company earns about ₹67.95 lakh in net income but only ₹12.95 lakh in free cash flow because working capital and capital expenditure absorb cash.
An AI assistant can help draft the explanation:
“Profitability improves due to revenue growth and controlled operating expenses, but free cash flow remains weak because the business requires additional working capital and capital expenditure to support growth.”
The analyst should then check whether the working capital assumption is realistic.
Exact Pricing Structure for AI Financial Modeling in Excel
The cost depends on whether you are an individual, small business, finance team, or larger company.
The numbers below are publicly listed prices reviewed from official pricing pages available in July 2026. Prices can change by region, tax, billing term, promotion, and availability.
| Tool or Plan | Listed Price | What It Gives You | Hidden Cost to Watch |
|---|---|---|---|
| Excel for the web | Free with Microsoft account | Basic spreadsheet modeling online | Fewer desktop features |
| Office Home 2024 | ₹10,999 one-time purchase | Classic desktop Office apps for one PC or Mac | No ongoing feature upgrades like Microsoft 365 subscription |
| Microsoft 365 Personal | ₹6,899 per year or ₹689 per month | Desktop Excel and Microsoft 365 apps with Copilot features for one person | Subscription renews unless cancelled |
| Microsoft 365 Premium | ₹19,999 per year or ₹1,999 per month | Higher AI usage and advanced Copilot access for individual use | AI benefits are for the subscription owner and cannot be shared |
| Microsoft 365 Business Basic | ₹170 per user per month, paid yearly | Web and mobile apps, business email, cloud storage | Desktop Excel is not included |
| Microsoft 365 Apps for business | ₹830 per user per month, paid yearly | Desktop Excel and Office apps | GST extra and annual renewal |
| Microsoft 365 Business Standard with Copilot | ₹1,955 per user per month, paid yearly | Desktop, web, and mobile apps plus Copilot for business | GST extra and availability can vary by market |
| Microsoft 365 Business Premium with Copilot | ₹2,660 per user per month, paid yearly | Apps, Copilot, security, and business management features | Higher cost than most small teams need |
| Python in Excel add-on | Add-on pricing varies by license and market | More premium compute and calculation control | Qualifying Microsoft 365 plan required |
| ChatGPT Business | $20 per user per month when billed annually, $25 monthly | AI workspace with connectors and team administration | Minimum 2 users for Business |
| Google Workspace Business Starter | $7 per user per month annually, $8.40 flexible | Google Sheets, Workspace apps, and Gemini access in eligible Workspace plans | Gemini depth depends on plan and capacity |
| Rows Plus | $8 per user per month monthly, $6 annually | AI spreadsheet tasks and connected data workflows | AI task limits apply |
| Rows Pro | $79 per month plus $8 per user monthly, or $59 plus $6 annually | More AI tasks, automations, integrations, and guests | Prices exclude applicable sales tax or VAT |
Microsoft’s consumer pricing page lists Microsoft 365 Personal at ₹6,899 per year or ₹689 per month, Microsoft 365 Premium at ₹19,999 per year or ₹1,999 per month, and Office Home 2024 at ₹10,999. Microsoft’s business page lists Business Standard with Copilot at ₹1,955 per user per month and Business Premium with Copilot at ₹2,660 per user per month on annual billing, with GST extra.
OpenAI lists ChatGPT Business at $20 per user per month when billed annually, with $25 per user per month when billed monthly and a 2 user minimum. Google’s Workspace help page lists Business Starter at $7 per user per month on annual billing and $8.40 on flexible billing, while noting equivalent local currency may apply. Rows lists Plus at $8 per user per month on monthly billing and Pro at $79 per month plus $8 per user per month, with annual discounts available.
AI Excel vs ChatGPT vs Google Sheets vs Rows
| Platform | Best For | Starting Cost | Strength | Limitation |
|---|---|---|---|---|
| Microsoft Excel with Copilot | Finance teams already working in Excel | From Microsoft 365 plans, Copilot plans cost more | Native Excel formulas, charts, PivotTables, workbook editing | Requires eligible Microsoft plan and user review |
| Excel with Python | Analysts who need statistics, simulations, and advanced analysis | Included with qualifying Microsoft 365 plan, premium compute may need add-on | Combines spreadsheet workflow with Python libraries | Internet required and availability varies by platform |
| ChatGPT | Explaining models, drafting formulas, reviewing logic, summarizing files | Free plan available, Business from $20 per user per month annually | Strong natural language explanation and workflow support | Not native Excel unless files are uploaded or connectors are used |
| Google Sheets with Gemini | Collaborative planning and spreadsheet work in Google Workspace | Business Starter from $7 per user per month annually | Strong collaboration and Workspace integration | Finance modeling depth may be weaker than Excel for advanced users |
| Rows AI | Lightweight AI spreadsheet workflows and data automation | Free plan, Plus from $8 per user per month monthly | Good for quick AI tasks, extraction, imports, and connected reports | Less standard than Excel in finance hiring and corporate finance teams |
| Traditional Excel without AI | Auditable modeling and finance workflows | Free web version or paid license | Familiar, flexible, trusted by finance professionals | Slower manual work and more formula burden |
Which Platform Wins?
Excel with Copilot wins for finance teams that already live in Excel and need AI support inside the workbook. It is best for budgets, dashboards, charts, PivotTables, variance analysis, and formula assistance.
Excel with Python wins for advanced analysts who need simulations, statistical analysis, or larger data workflows inside the spreadsheet environment.
ChatGPT wins for explaining logic, drafting model structures, summarizing financial statements, creating formulas, and writing commentary. It is very useful beside Excel, even when the final model stays in Excel.
Google Sheets with Gemini wins for teams that prioritize real-time collaboration and already use Google Workspace.
Rows wins for users who want an AI-first spreadsheet-style workflow with data extraction, AI tasks, integrations, and quick reporting.
Traditional Excel still wins when auditability, offline files, lender comfort, and finance-team familiarity matter more than AI speed.
Where AI Financial Modeling Can Go Wrong
AI can save time, but it also introduces risk.
Wrong Formulas
AI may write a formula that looks correct but uses the wrong base.
Example:
- Using ending debt instead of average debt for interest expense.
- Using revenue instead of cost of goods sold to calculate inventory days.
- Using EBITDA instead of free cash flow for valuation.
These errors can materially change the result.
Unsupported Assumptions
AI may suggest a 15% revenue growth rate or 40% gross margin without knowing the business.
Assumptions should come from historical data, signed contracts, market research, pricing, capacity, management plans, and industry benchmarks.
Hidden Circularity
Financial models often contain circular relationships.
Debt affects interest expense. Interest expense affects net income. Net income affects cash. Cash affects debt repayment.
AI may not catch circularity unless checks are built clearly.
Weak Source Verification
AI summaries of filings, reports, or contracts should be checked against the original document.
The SEC says a Form 10-K gives a detailed picture of a company’s business, risks, and financial results for the fiscal year. That makes it a strong source, but only if the analyst reads and verifies the actual filing.
Privacy and Data Risk
Finance models may include salary data, customer names, pricing terms, lender covenants, acquisition targets, and confidential forecasts.
Do not upload sensitive files into tools unless your organization approves the security, privacy, retention, and access controls.
OpenAI states that ChatGPT Business includes no training on business data by default, centralized billing and administration, SAML SSO and MFA, and secure workspace features. Microsoft also distinguishes basic Copilot Chat from deeper Microsoft 365 Copilot integration with apps and organizational data.
Security review is not optional for business finance work.
Best Practices for AI Financial Modeling in Excel
Keep Assumptions Separate
Put every major assumption in one section.
Do not hide growth rates inside formulas.
Bad formula:
=B12*1.12
Better formula:
=B12*(1+$C$5)
The second formula lets the user change the growth rate in one assumption cell.
Use Clear Color Coding
A common finance convention is:
| Cell Type | Suggested Use |
|---|---|
| Blue font | Hardcoded inputs |
| Black font | Formulas |
| Green font | Links from other worksheets |
| Red font | External links or alerts |
AI can help create a model, but human readers need formatting discipline.
Add Error Checks
Include visible checks.
| Check | Purpose |
|---|---|
| Balance Sheet Check | Confirms assets equal liabilities plus equity |
| Cash Check | Flags negative cash balances |
| Debt Check | Prevents negative debt balances |
| Margin Check | Flags unusual margin changes |
| Formula Check | Ensures copied formulas are consistent |
| Scenario Check | Confirms correct scenario selection |
Ask AI to Explain, Not Just Build
A useful prompt is:
- “Explain this model logic in plain English and identify assumptions that should be reviewed.”
Another useful prompt:
- “List five ways this forecast could be wrong.”
This helps reduce false confidence.
Test the Model Manually
Change the assumptions and watch what happens.
If revenue growth increases, revenue should rise.
If DSO increases, accounts receivable should rise and cash should fall.
If interest rate increases, interest expense should rise and net income should fall.
If the model does not behave logically, the formulas need review.
Verifiable Financial Facts and Data for AI Modeling
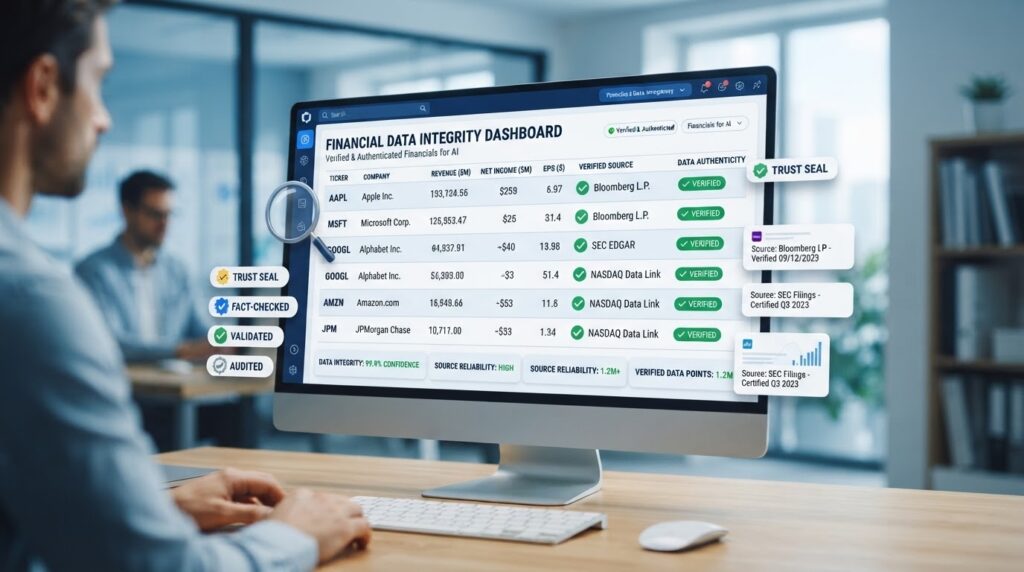
AI financial models should be grounded in reliable data.
For public companies, EDGAR provides free public access to corporate information, including Forms 10-K and 10-Q.
For company analysis, Form 10-K filings provide details on the company’s business, risks, and financial results for the fiscal year.
For cash planning, FDIC insurance covers $250,000 per depositor, per FDIC-insured bank, for each account ownership category. This matters for companies and investors holding large cash balances, but it does not protect investments.
For brokerage assets, SIPC says it does not protect against a decline in the value of securities. This distinction matters if a financial model includes investment accounts, brokerage cash, or marketable securities.
For spreadsheet work, Microsoft’s support pages show that Copilot in Excel can use Excel tools such as charts, PivotTables, formulas, sorting, filtering, and conditional formatting, but Microsoft also reminds users to review, edit, and verify AI-created output.
The practical lesson is simple: AI can help analyze data, but the data source and model logic must still be verified.
Who Should Use AI Financial Modeling in Excel?
AI financial modeling is a strong fit for:
- Finance students learning Excel models
- FP&A analysts building budgets and forecasts
- Startup founders preparing cash runway models
- Small business owners reviewing profitability and cash flow
- Investors analyzing public companies
- CFOs preparing management reports
- Accountants moving into advisory work
- Consultants building client models
- Analysts creating scenario analysis and dashboards
It is especially useful when the user already understands the financial logic and needs help with speed, formatting, formulas, commentary, and first-pass analysis.
Who Should Avoid It?
AI financial modeling is not ideal for users who want to avoid learning finance basics.
If you do not understand revenue, gross margin, EBITDA, working capital, depreciation, debt, interest, tax, free cash flow, or valuation, AI can make mistakes look polished.
It is also risky for:
- Audited financial reporting without review
- Loan covenant reporting without validation
- Acquisition models without due diligence
- Tax-sensitive models without professional advice
- Investor decks based on unsupported assumptions
- Confidential files uploaded without approval
- Board models with no formula checks
AI should not be used as the final authority in financial decisions.
Final Strategic Verdict
AI financial modeling in Excel is perfect for people who already use Excel and want to build, analyze, explain, and review models faster.
It is especially useful for budgeting, forecasting, variance analysis, three-statement modeling, DCF valuation, cash flow planning, dashboard creation, and management commentary.
Microsoft Excel with Copilot is the best fit for finance teams that want AI inside the spreadsheet environment. ChatGPT is excellent as a companion for explaining model logic, drafting formulas, checking assumptions, and writing summaries. Google Sheets with Gemini is better for teams already using Google Workspace. Rows is useful for lighter AI spreadsheet workflows and connected reporting.
Avoid treating AI as a finance expert that cannot be questioned.
The best setup is human-led and AI-assisted. You define the business question, source the data, set the assumptions, check the formulas, review the outputs, and use AI to accelerate the work.
That is where AI financial modeling in Excel becomes valuable: not because it replaces judgment, but because it helps good judgment move faster.